SQL Server Management Studio a graphical interactive that allows you to interact with the databases hosted on your servers. SSMS provides you with the ability to write, edit, execute, analyze and monitor your SQL queries. It also helps database administrators answer important questions about the SQL query performance, such as why a query is slow or why an index is not used. The answer to these questions can be found simply by tracking the Query Execution Plan.
The Query Execution Plan is a graphical display for the query execution roadmap that is followed by the SQL Server Query Optimizer, identifying the cost of executing each piece of code within the query. The Execution Plans can be represented also in XML format, specified by the SET SHOWPLAN_ALL, SET SHOWPLAN_TEXT or SET SHOWPLAN_XML commands.
Before going too deep in the type of execution plans and the Live Execution Plan new feature which is the main focus of our article here, let’s briefly describe how SQL Server queries are executed.
When a SQL query is submitted, the query syntax will be checked, to make sure that it is written in the correct format, in a process called Query Parsing. The logical steps that are required to execute the query are the output of that parsing process. The output of the parsing process will be passed to the Algebrizer which is responsible for resolving different objects names within the databases used in the query. Once all objects names are resolved, the SQL Server Query Optimizer takes over. The Query Optimizer is responsible for specifying the best way to execute the submitted query, by generating many candidate execution plans and choose the lowest cost query in terms of CPU, Memory and IO resources consumption and the time required to execute the query. By finding the most optimal compromise between these factors the most efficient execution plan can be generated. The SQL Server Query Optimizer depends on the SQL Server Statistics, which describes the data and indexes distribution and metadata in the database, to take that decision. Once the Query Optimizer generates the best plan, it will store it in the Plan Cache storage. This plan will be used now by the SQL Storage Engine to execute the query and retrieve or manipulate the requested data.
There are two main types of execution plans that can be displayed by SQL Server Management Studio; the Estimated Execution Plan that shows the approximate execution steps generated by parsing the query without executing it, and the Actual Execution Plan that shows the real steps followed in executing the query, which requires executing the query before generating that plan. In some cases, you may notice a difference between the actual and estimated execution plans due to a difference between the SQL Server Statistics and the actual data, which can be resolved by updating the database statistics.
SQL Server 2016 introduces a new feature that allows you to view the Live Execution Statistics for your active query, showing the run-time execution statistics for each execution plan operator such as the number of rows, the time required by each operator and the operator and overall execution progress, without waiting for the query execution to finish. It allows you to track the data flow between the operators in real time one by one till the query execution completed.
This feature is very useful in troubleshooting the performance issues of the bad queries with huge execution plans, where it will be difficult and time consuming to identify the part that is performing incorrectly. Make sure that you have SHOWPLAN database level permission in order to generate the Live Query Statistics plan, VIEW SERVER STAT permission to be able to see the live statistics and finally the proper access to execute your query.
SQL Server Management Studio allows you to enable the Live Query Statistics for your query in many ways:
From the SQL Server Management Studio SQL Editor Toolbar click on the
 icon that will include the Live Query Statistics to your query as follows:
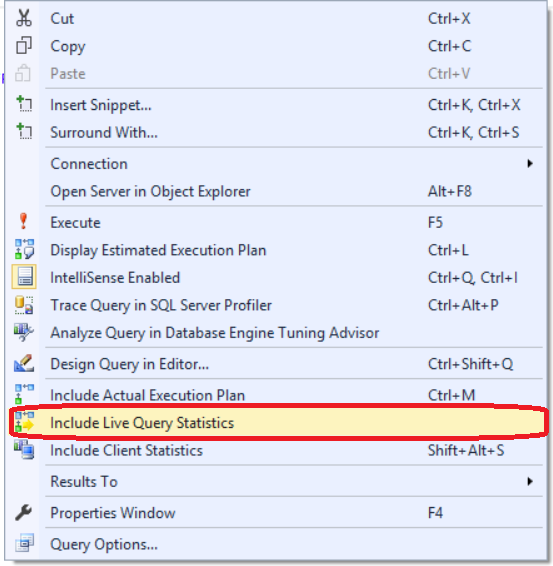
Right-click on your query text and choose the Include Live Query Statistics option from the viewed list as below:
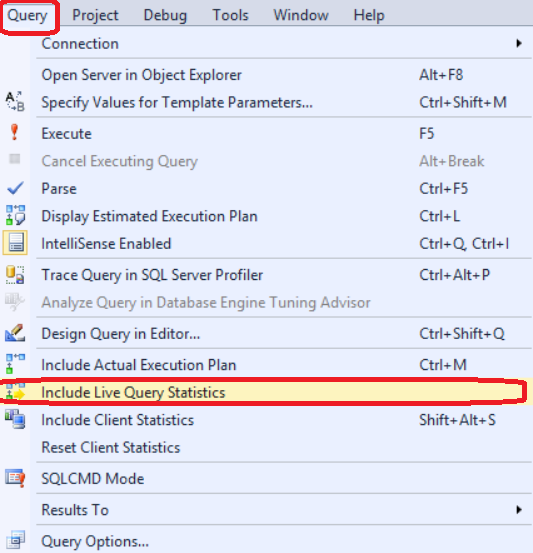
Select the Query menu from the SQL Server Management Studio Menu bar and choose the Include Live Query Statistics option as follows:
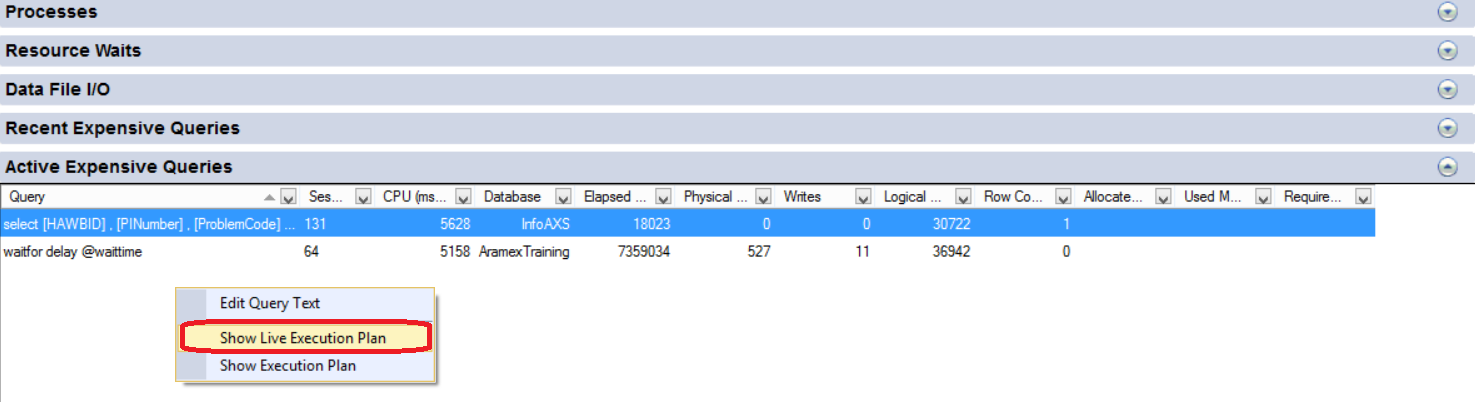
From the SQL Server Management Studio Activity Monitor, right-click on the active query from the Active Expensive Query list and choose Show Live Execution Plan option as below:
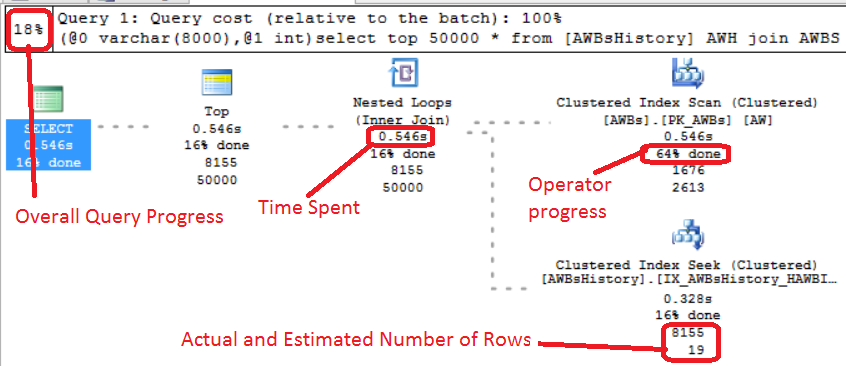
Once the Live Execution Statistics feature is enabled in your query using one of the previously mentioned methods, the query can be run and the data flow between the operators can be tracked in the form of dashed lines during execution and one line arrow when the operator process completed, the time spent by each operator, the progress percentage on these operators, the actual and estimated number of rows processed by each operator and the overall query progress as in the detailed figure below:
The below figure also show you how the Live Execution Statistics changed with time till the query execution completed:
Let’s go through a simple demo to show how we can leverage the benefits of the Live Execution Statistics to track a query, allocate the problem and enhance the SQL query performance. Suppose that we have the below query from our SQLShackDemo database, that is running very frequently, and is slowing down the HR system, and we are requested as database administration team to allocate the issue and enhance the SQL query performance. To start troubleshooting that query, we will run the query after enabling the Live Execution Statistics feature on it:
123456789101112USE SQLShackDemoGOSELECT DEP.[DepartmentID],DEP.[Name],DEP.[GroupName],DEP.[ModifiedDate]FROM [SQLShackDemo].[HumanResources].[Department] DEPJOIN [SQLShackDemo].[HumanResources].[EmployeeDepartmentHistory] EDHON DEP.[DepartmentID] =EDH.[DepartmentID]where DEP.[GroupName] like '%Quality%' and DEP.[ModifiedDate] not like'1999-10-30'The Live Execution statistics resulted from running the query will be like:
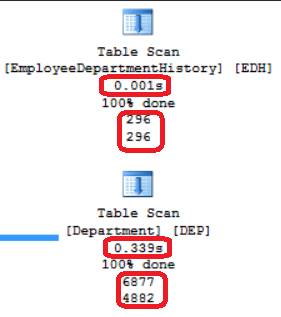
As you can see from the previous result, the Table Scan operator on the Department table is the main part that slows down the query, as it takes longer time to complete than the EmployeeDepartmentHistory table scan and reads more records, which is clear from the previous live data flow and the result below:
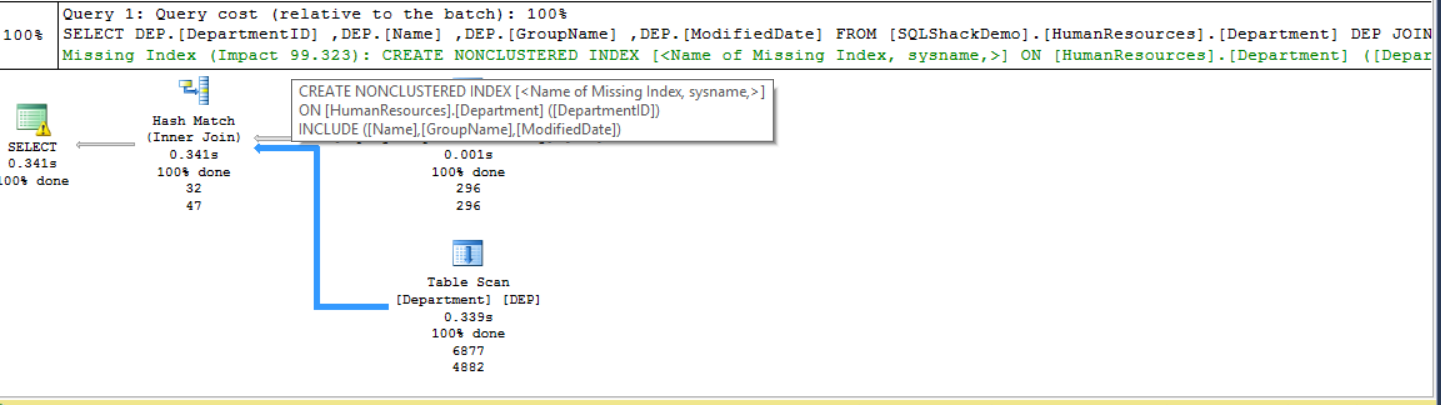
To enhance the Department table scan problem, the execution plan itself suggests a missing index that will enhance the SQL query performance with 99% percent as shown in green in the following plan snapshot:
Right-click on the plan and choose Missing Index Details to show the script to create that missing index. Edit the name of the index to match your company naming convention then run it to create that index. The index creation script is similar to the below:
12345678USE [SQLShackDemo]GOCREATE NONCLUSTERED INDEX [IX_Department_DepartmentID]ON [HumanResources].[Department] ([DepartmentID])INCLUDE ([Name],[GroupName],[ModifiedDate])GOLet’s run the previous query again and check the Live Execution Statistics again, the new plan will be like:
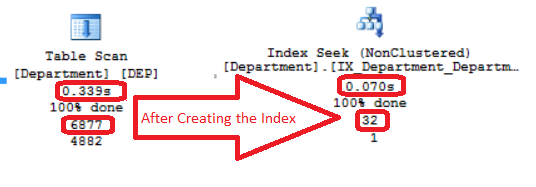
As you can see from the previous plan, the Department Table Scan operator becomes Index Seek, and the operator time decreased from 0.339 seconds to 0.07 seconds only. You can also see the IO enhancement after creating the index, where the actual number of rows that is read from the Department decreased from 6877 records to only 32 records, as it will read from the index directly without the need to scan the overall table. The below figure show you what we gain from creating the new Index on the Department table:
Conclusion
SQL Server Live Execution Statistics is a useful feature that helps you in troubleshooting SQL query performance in real time and allocate and fix poorly performance parts of the queries without the need to wait for the query execution to complete. You can figure out the time and effort that you can save when using this feature to debug your queries specially the ones with huge execution plans that are not easy to allocate the most expensive part and the ones that take long time, which you don’t need to wait for the execution to complete in order to detect where the query stuck. Although Live Execution Statistics feature is introduced in SQL Server 2016, it can be run on SQL Server 2014 SP1 using the SQL Server 2016 Management Studio.
There are a few limitations in the Live Execution Statistics feature, where you can only use it against normal table, as it can’t be used to track the Memory-Optimized tables, the tables with ColumnStore index or the Natively Compiled stored procedures.
Ahmad Yaseen is a Microsoft Big Data engineer with deep knowledge and experience in SQL BI, SQL Server Database Administration and Development fields.
He is a Microsoft Certified Solution Expert in Data Management and Analytics, Microsoft Certified Solution Associate in SQL Database Administration and Development, Azure Developer Associate and Microsoft Certified Trainer.
Also, he is contributing with his SQL tips in many blogs.
View all posts by Ahmad YaseenLatest posts by Ahmad Yaseen (see all)- Azure Data Factory Interview Questions and Answers - February 11, 2021
- How to monitor Azure Data Factory - January 15, 2021
- Using Source Control in Azure Data Factory - January 12, 2021
 icon that will include the Live Query Statistics to your query as follows: