
Dynamic management views (DMVs) and dynamic management functions (DMFs) are system views and system functions that return metadata of the system state. On querying the related system objects, database administrators can understand the internals of SQL Server. It allows us to monitor the performance of the SQL Server instance, and diagnose issues with it.
SQL Server 2017 ships with a number of new and enhanced dynamic management views and dynamic management functions that will help DBAs monitor the health and performance of SQL Server instances. A few existing DMV’s such as sys.dm_os_sys_info and sys.dm_db_file_space_usage have been enhanced. Some have also been newly built and available only for SQL Server 2017.
The new or enhanced DMV’s/DMF’s fall into the three categories:
-
Database related
- sys.dm_db_log_stats
- sys.dm_db_log_info
- sys.dm_db_stats_histogram
- sys.dm_db_file_space_usage
- sys.sys.dm_db_tuning_recommendations
-
Transaction related
- sys.dm_tran_version_store_space_usage
- SQL Server Operating System related
- sys.dm_os_host_info
- sys.dm_os_sys_info
sys.dm_db_log_stats
Let’s take a look at them by creating a new query here, and typing in select * from. The first view I want to work with is sys.dm_db_log_stats. It requires the database ID number you want to investigate, so I’m going to type in the number one inside the parenthesis to indicate the master database.
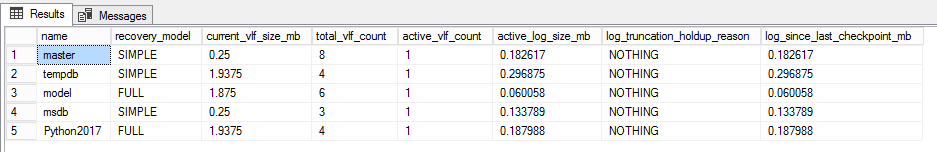
Let’s go ahead and execute the statement. This DMV returns information about the transaction log files. The information includes the recovery model of the database.
We can see that Python2017 database is using the FULL recovery model. The other columns give the total log size in megabytes. Also, we can see some information about the last time the log was backed up. In this case, the database transaction log was never backed up, so it’s reporting as of January 1, 1900.
|
1 2 3 4 5 6 7 8 9 10 11 |
select db_NAME(database_id) dbname, recovery_model, current_vlf_size_mb, total_vlf_count, active_vlf_count, active_log_size_mb, log_truncation_holdup_reason, log_since_last_checkpoint_mb from sys.dm_db_log_Stats(5) |

It is this easy to project the data for the entire database by cross-joining with the sys.databases system view. The derived output gives very useful information about the database and the log structure.
|
1 2 3 4 5 6 7 8 9 10 11 12 13 |
select dbs.name, b2.recovery_model, b2.current_vlf_size_mb, b2.total_vlf_count, b2.active_vlf_count, b2.active_log_size_mb, b2.log_truncation_holdup_reason, b2.log_since_last_checkpoint_mb from sys.databases AS dbs CROSS APPLY sys.dm_db_log_Stats(dbs.database_id) b2 where dbs.database_id=b2.database_id |
sys.dm_db_log_info
The sys.dm_db log_info also deals with the log files. It requires the database ID for input. This view specifically looks at virtual log files or VLFs. These make up the transaction log of the database and having a large number of VLFs can negatively impact the startup and recovery time of your database. With this view, we can see how many VLFs your database currently has, along with their size and status. This management view replaces the database console command, dbcc log info.
|
1 2 3 4 5 6 7 8 9 10 |
select db_NAME(database_id) dbname, file_id, vlf_begin_offset, vlf_size_mb, vlf_sequence_number, vlf_active, vlf_status from sys.dm_db_log_info(5) b |
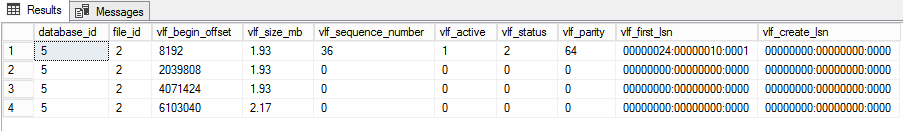
In the following sample T-SQL, we can see that the output of the DMV is joined with sys.databases, a system view to get consolidated data about all the databases of the SQL instance
The DMV sys.dm_db_log_info is explained with an example here
sys.dm_db_tuning_recommendations
The new DMV returns the detailed tuning recommendations information. This requires an enabling of the automatic tuning option. If the database engine identifies the plan that is causing regression then a suggestion will be made for fixing it using this dmv.
sys.dm_tran_version_store_space_usage
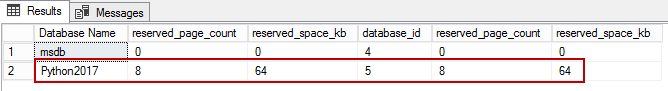
The sys.dm_tran_version_store_space_usage is used to track version store usage per database in tempdb. This is pretty useful in proactively monitoring the tempdb sizing on the version store usage requirement of each database. This DMV returns the aggregated version store space consumed in tempdb per database. It doesn’t have any arguments that need to be supplied. The results show the databaseID, the count of pages reserved in tempdb for version store records, and the total space in kilobytes.
For example, the Python2017 database is set with ALLOW_SNAPSHOT_ISOLATION option.
|
1 2 3 4 5 6 7 8 9 10 11 12 13 14 15 16 17 |
ALTER DATABASE Python2017 SET ALLOW_SNAPSHOT_ISOLATION ON; CREATE TABLE SQLShackTest ( id INT, name VARCHAR(20)) INSERT INTO SQLShackTest VALUES(1,'thanvitha'),(2,'SQLShack') UPDATE SQLShackTest set id=100 where name='SQLShack' SELECT DB_NAME(database_id) as 'DatabaseName', reserved_page_count, reserved_space_kb ,* FROM sys.dm_tran_version_store_space_usage; |
sys.dm_db_stats_histogram
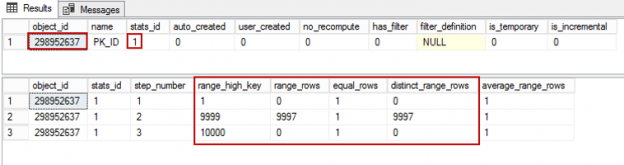
The next dmv is sys.dm_db_stats_histogram. It requires two arguments, object_ID and a stats_ID that we get it in sys.stats system view. This DMV is similar to dbcc show_statistics with histogram command.
|
1 2 3 4 5 6 7 8 9 10 11 12 13 |
CREATE TABLE SQLShack ( id INT IDENTITY (1,1) CONSTRAINT PK_ID PRIMARY KEY, name VARCHAR(20)) INSERT INTO SQLShack(name) VALUES('SQLShack' ) GO 10000 select * from sys.stats where OBJECT_ID=object_id('SQLShack') ALTER TABLE sqlshack REBUILD select * from sys.dm_db_stats_histogram (298952637,1) |
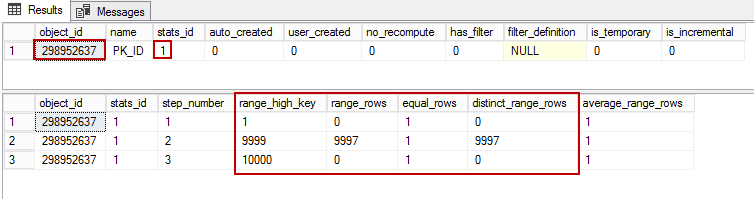
Let’s take a look at the statistics for this object. The results contain details on the frequency of occurrence for each distinct value in the table. These are the values the query optimizer uses to help choose a plan when running a query.
This particular table had 10,000 records with a unique integer in each. The rows are evaluated between the ranges 0 and 1, 1 and 9,999, and, and 10,000. So the histogram shows that data split into three steps. The first step includes the values between zero and the range high key of one. The second step includes the numbers between 1 and 9999. It shows we have 99,997 records that are within that range and one record that exactly matches the high key of 9999. Finally, the last range is for all the numbers between 9999 and 10000. There aren’t any within that range, and there is only a single one that matched the high key.
sys.dm_os_host_info
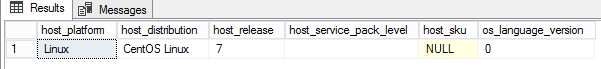
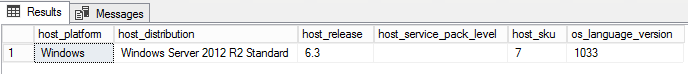
The sys.dm_os_host_info returns information about the host operating system that the server instance is running. This will also run in Linux machines and will identify the distribution of Linux as well.
|
1 |
select * from sys.dm_os_host_info |
sys.dm_os_sys_info
The sys.dm_os_sys_info returns some useful information about the resources used by, as well as available to, the SQL Server instance. The three newly added columns are:
- socket_count
- cores_per_socket
- numa_node_count

sys.dm_db_file_space_usage
The sys.dm_db_file_space_usage is the DMV that returns space usage information of the database.
The newly added column modified_extent_page_count column gives us the flexibility to manage backups. The modified page count can be used to track differential changes in the database since the last full backup to decide if a differential backup is beneficial. The column is the total number of pages modified in the allocated extents of the file since the last full database backup.
It’s demo time
Let’s consider a backup strategy for VLDB
- Weekly full backup
- Daily differential backup
- Hourly log backups
The differential backup is a collection of modified pages since the last full backup. The DMV sys.dm_db_file_space_usage introduces a new column called modified_extent_page_count that gives us details about the modified pages since the last full backup. The value of this column is used as a reference for initiating the differential backup process.
- Backup the database
- Query the sys.dm_db_file_space_usage dmv
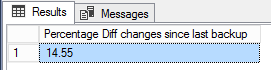
- Validate the differential change, the amount of data changes since the last full backup; we see a 14.55% change in the data
- Build the logic to initiate a differential backup process; in our case, if there’s a change of 10% or more, a differential backup would be initiated
|
1 2 3 4 5 6 7 8 9 10 |
BACKUP DATABASE Python2017 to disk='f:\PowerSQL\Python2017.bak' SELECT CAST(ROUND((SUM(modified_extent_page_count)*100.0)/SUM(allocated_extent_page_count),2) as decimal(10,2)) as [Diff %] from sys.dm_db_file_space_usage update [dbo].[SQLShack] set name='SQLShack_1' The following query highlights how much data has been changed since the last full backup SELECT CAST(ROUND((SUM(modified_extent_page_count)*100.0)/SUM(allocated_extent_page_count),2) as decimal(10,2)) as [Percentage change since last backup] from sys.dm_db_file_space_usage |
|
1 2 3 |
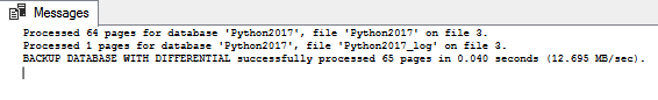
IF ( (SELECT CAST(ROUND((SUM(modified_extent_page_count)*100.0)/SUM(allocated_extent_page_count),2) as decimal(10,2)) as [Percentage Diff changes since last backup] from sys.dm_db_file_space_usage) >10) BACKUP DATABASE Python2017 to disk='f:\PowerSQL\Python2017.bak' WITH DIFFERENTIAL |
Wrapping up
The overview of new dynamic management views and dynamic management functions that ship with SQL Server 2017 have been explained in detail. They can be put to use to get more insight into the status of the system. It can be informative and useful for the administrators to understand the metadata pertaining to the SQL Server instance. To me, the sys.dm_db_file_space_usage and sys.dm_db_tuning_recommendations turns out to be something I was looking for, for a long time. How about you? Please feel free to comment!
Table of contents

My specialty lies in designing & implementing High availability solutions and cross-platform DB Migration. The technologies currently working on are SQL Server, PowerShell, Oracle and MongoDB.
View all posts by Prashanth Jayaram
- Stairway to SQL essentials - April 7, 2021
- A quick overview of database audit in SQL - January 28, 2021
- How to set up Azure Data Sync between Azure SQL databases and on-premises SQL Server - January 20, 2021