
In the previous article, we have examined the physical structure of the transaction log and discussed WAL algorithm. Now I will take you on a journey through the most common reasons for experiencing a log bottleneck in your systems.
Unused Non-Clustered Indexes
Nowadays, the expectations for modern databases are set very high and we are anticipating almost instantaneous answers. In order to meet these expectations, indexes are must-have objects. However one of the most widespread mistakes is to create every index proposed from SQL Server or different performance tools. When we are updating our data, we need to update records into each non-clustered index (not applicable only for filtered indexes). In order to do this, SQL is generating the additional log records placing the unnecessary overhead. We need to monitor our tables and remove unused indexes which can be achieved by using “sys.dm_db_index_usage_stats”.
Since the information in this view is not persistent, it can be cleared under one of the following circumstances:
- SQL is restarted
- Detach/Attach a database
- Take database offline/online
- Restore a database
- Rebuild an index (only for the index/indexes that were rebuilt)
You cannot solely leverage on the information you will receive by querying this view only, thus, a solution should be developed. This can be taking the info from this DMV every 1 hour and storing it in a specific table for your database; alternatively, some kind of a central solution for all of your databases should be considered.
This view has another “nasty” characteristic – it is not showing when you are using only index statistics to satisfy your query. Let’s see an example. I will use default database “AdventureWorksDW2008R2”:
|
1 2 3 4 5 6 7 8 9 10 11 |
USE [master] GO ALTER DATABASE [AdventureWorksDW2008R2] SET AUTO_CREATE_STATISTICS OFF WITH NO_WAIT GO USE [AdventureWorksDW2008R2] GO SELECT RevisionNumber FROM dbo.FactInternetSales WHERE TaxAmt = 5.08 |
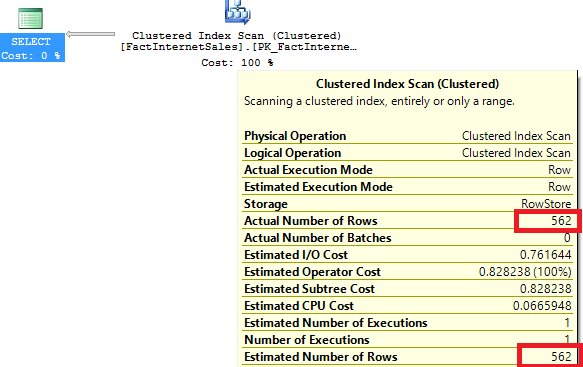
Here is the execution plan:

The cardinality we have is not good at all! Now let’s create a new index to improve this and check again the plan:
|
1 2 3 4 5 6 7 8 9 |
CREATE INDEX IX_FactInternetSales_TaxAmt ON dbo.FactInternetSales (TaxAmt) USE [AdventureWorksDW2008R2] GO SELECT RevisionNumber FROM dbo.FactInternetSales WHERE TaxAmt = 5.08 |
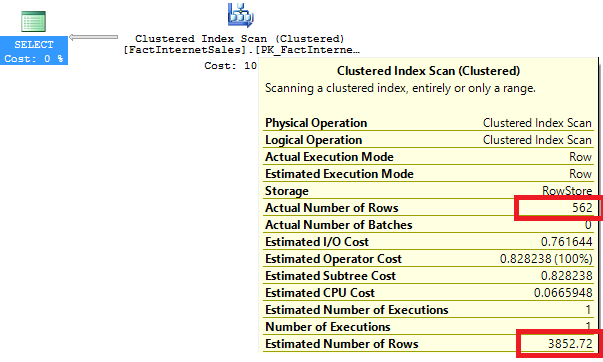
The situation seems a lot better after we have created the index. So I would say that we are using it and this is great. Let’s examine the DMV “sys.dm_db_index_usage_stats”:
|
1 2 3 4 5 6 7 8 9 |
SELECT i.name,u.user_seeks, u.user_lookups, u.user_scans FROM sys.dm_db_index_usage_stats u INNER JOIN sys.indexes i ON u.object_id = i.object_id AND u.index_id = i.index_id WHERE u.object_id=object_id('dbo.FactInternetSales') AND i.name = 'IX_FactInternetSales_TaxAmt' |

The result is not matching the expected one and it looks like we are not using this index at all. It should be then safe to drop it and test the query again:
|
1 2 3 4 5 6 7 8 9 |
USE [AdventureWorksDW2008R2] GO DROP INDEX [IX_FactInternetSales_TaxAmt] ON [dbo].[FactInternetSales] WITH ( ONLINE = OFF ) GO SELECT RevisionNumber FROM dbo.FactInternetSales WHERE TaxAmt = 5.08 |
Credit for the demo: Joe Sack
We are back to the initial cardinality issue. SQL has used only the statistic of the index, but not the index itself, to improve the cardinality of our query. In these cases the DMV is not showing any information and this could easily mislead us.
Log Autogrowth Setting
Among the most common causes for the log performance problems, is the log autogrowth setting. It is a prevalent mistake, to left the autogrowth step to the default one – it is 10% not what is configured for the “model” database:
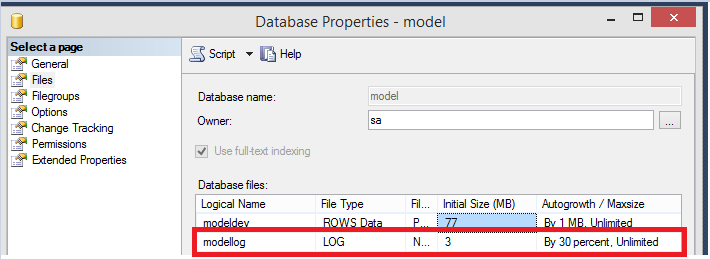
Let’s create a new test database without specifying anything:
|
1 2 3 4 |
CREATE DATABASE LogSetting GO |
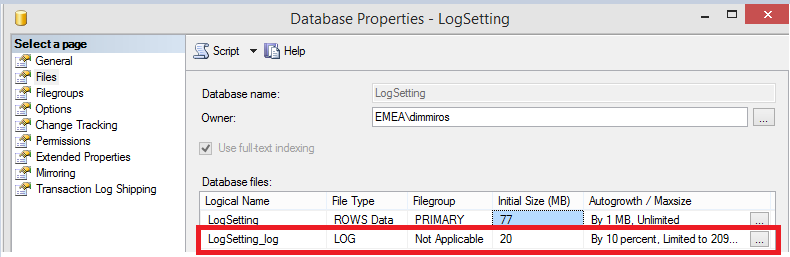
For the majority of the databases, the general log settings are not the optimal ones. Why is that so critical and important?
SQL Server must always zero-initialized the new space added to the transaction log regardless of the “Perform volume maintenance task” policy! You can only benefit from this option when it comes to adding a new space for a data file but it does not have any effect on the transaction log. The transaction log is being used by SQL Server to recover our databases to a consistent state. There is a very small chance that the old data that was previously occupying the portion of the file system that you are now using to expand the log would try to fool a database that these are the valid log records. If this happens, the result of the recovery would be unpredictable and it is almost guaranteed that we will end up with the corrupted data. Furthermore, while the zero-initialization is happening, log records cannot be flushed to a disk! Dramatic performance degradation might take place if your autogrowth setting is not well configured – for example set to a very large number.
In a perfect world you should avoid log autogrowth. This is achievable by allowing your log to be cleared regularly so there is always free space that can be reused. I have seen many discussions on this topic, but log clearing (also known as log truncation) is only happening during log backups when your database is in the FULL or the BULK-LOGGED recovery models! In the SIMPLE recovery model, this task is handled whenever a CHECKPOINT is fired.
High Availability Features
For the sake of completeness, I will also briefly talk about High Availability features as one of the top contributors to the transaction log’s throughput issues. The following high availability features can also bring additional delay in the log clearing:
- Database Mirroring running in synchronous mode
- Availability Groups running in synchronous mode
- Transactional Replication
When you are using mirroring and availability groups in a sync mode, any transaction that executes on the principal will only return acknowledgment to the application once all the associated log records have been committed to the mirror or the replica. If you are having an average large transaction size, this may not be that problematic but if the size is relatively small, the effect would be stronger and more noticeable. In this situation you can change your workload, if possible, increase your network bandwidth or simply go to the asynchronous mode.
With the transactional replication, you are leveraging on your Log Reader agent to run regularly and to scan the log records associated with the objects participating in the replication. Sometimes the agent might fail due to something; for example, I have seen it deliberately made to run infrequently. If such a failure occurs all the LSNs, that have not been yet scanned, must be kept and this is preventing the log truncation.
Fragmented Indexes
Fragmented indexes can be a reason of various problems among which is performance degradation for queries that need to process relatively large amount of data. Although valid and significant, fragmentation is causing troubles in the way it occurs – it is based on an activity called the “page split”. The most widespread situation is when an index record must be inserted on a particular page and the page does not have enough space to accommodate it. In this case, SQL Server will need to perform the following actions:
- A new index page is allocated and formatted
- Part of the records are moved to the new page in order to release some space
- The new page is linked to the structure of the index
- The new data is inserted on the respective page
The biggest downside is not that these additional operations are slowing our queries down; it is the fact that extra transaction log records are being generated for each activity.
Now, let’s test this. First, create a test database with one simple table and clustered index:
|
1 2 3 4 5 6 7 8 9 10 |
CREATE DATABASE PageSplitDemo; GO USE pagesplitdemo; GO CREATE TABLE PageSplit (c1 INT, c2 CHAR (100)); CREATE CLUSTERED INDEX PageSplit_CL ON PageSplit (c1); GO |
Then, insert records by making a gap for the 30th one:
|
1 2 3 4 5 6 7 8 9 10 11 12 13 14 15 16 17 18 19 20 21 22 23 24 25 26 27 28 29 30 31 32 33 34 35 36 37 38 39 40 41 42 43 44 45 46 47 48 49 50 51 52 53 54 55 56 57 58 59 60 61 62 63 64 65 66 67 68 69 70 71 72 73 |
INSERT INTO PageSplit VALUES (1, 'a'); INSERT INTO PageSplit VALUES (2, 'a'); INSERT INTO PageSplit VALUES (3, 'a'); INSERT INTO PageSplit VALUES (4, 'a'); INSERT INTO PageSplit VALUES (6, 'a'); INSERT INTO PageSplit VALUES (7, 'a'); INSERT INTO PageSplit VALUES (8, 'a'); INSERT INTO PageSplit VALUES (9, 'a'); INSERT INTO PageSplit VALUES (10, 'a'); INSERT INTO PageSplit VALUES (11, 'a'); INSERT INTO PageSplit VALUES (12, 'a'); INSERT INTO PageSplit VALUES (13, 'a'); INSERT INTO PageSplit VALUES (14, 'a'); INSERT INTO PageSplit VALUES (15, 'a'); INSERT INTO PageSplit VALUES (16, 'a'); INSERT INTO PageSplit VALUES (17, 'a'); INSERT INTO PageSplit VALUES (18, 'a'); INSERT INTO PageSplit VALUES (19, 'a'); INSERT INTO PageSplit VALUES (20, 'a'); INSERT INTO PageSplit VALUES (21, 'a'); INSERT INTO PageSplit VALUES (22, 'a'); INSERT INTO PageSplit VALUES (23, 'a'); INSERT INTO PageSplit VALUES (24, 'a'); INSERT INTO PageSplit VALUES (25, 'a'); INSERT INTO PageSplit VALUES (26, 'a'); INSERT INTO PageSplit VALUES (27, 'a'); INSERT INTO PageSplit VALUES (28, 'a'); INSERT INTO PageSplit VALUES (29, 'a'); INSERT INTO PageSplit VALUES (31, 'a'); INSERT INTO PageSplit VALUES (32, 'a'); INSERT INTO PageSplit VALUES (33, 'a'); INSERT INTO PageSplit VALUES (34, 'a'); INSERT INTO PageSplit VALUES (35, 'a'); INSERT INTO PageSplit VALUES (36, 'a'); INSERT INTO PageSplit VALUES (37, 'a'); INSERT INTO PageSplit VALUES (38, 'a'); INSERT INTO PageSplit VALUES (39, 'a'); INSERT INTO PageSplit VALUES (40, 'a'); INSERT INTO PageSplit VALUES (41, 'a'); INSERT INTO PageSplit VALUES (41, 'a'); INSERT INTO PageSplit VALUES (42, 'a'); INSERT INTO PageSplit VALUES (43, 'a'); INSERT INTO PageSplit VALUES (44, 'a'); INSERT INTO PageSplit VALUES (45, 'a'); INSERT INTO PageSplit VALUES (46, 'a'); INSERT INTO PageSplit VALUES (47, 'a'); INSERT INTO PageSplit VALUES (48, 'a'); INSERT INTO PageSplit VALUES (49, 'a'); INSERT INTO PageSplit VALUES (50, 'a'); INSERT INTO PageSplit VALUES (51, 'a'); INSERT INTO PageSplit VALUES (52, 'a'); INSERT INTO PageSplit VALUES (53, 'a'); INSERT INTO PageSplit VALUES (54, 'a'); INSERT INTO PageSplit VALUES (55, 'a'); INSERT INTO PageSplit VALUES (56, 'a'); INSERT INTO PageSplit VALUES (57, 'a'); INSERT INTO PageSplit VALUES (58, 'a'); INSERT INTO PageSplit VALUES (59, 'a'); INSERT INTO PageSplit VALUES (60, 'a'); INSERT INTO PageSplit VALUES (61, 'a'); INSERT INTO PageSplit VALUES (62, 'a'); INSERT INTO PageSplit VALUES (63, 'a'); INSERT INTO PageSplit VALUES (64, 'a'); INSERT INTO PageSplit VALUES (65, 'a'); INSERT INTO PageSplit VALUES (66, 'a'); INSERT INTO PageSplit VALUES (67, 'a'); INSERT INTO PageSplit VALUES (68, 'a'); INSERT INTO PageSplit VALUES (69, 'a'); INSERT INTO PageSplit VALUES (70, 'a'); INSERT INTO PageSplit VALUES (71, 'a'); GO |
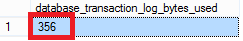
Next, insert the next value (which is 72) and check how many log this will generate:
|
1 2 3 4 5 6 7 8 9 |
BEGIN TRAN INSERT INTO PageSplit VALUES (72, 'a'); GO SELECT [database_transaction_log_bytes_used] FROM sys.dm_tran_database_transactions WHERE [database_id] = DB_ID ('PageSplitDemo'); GO |
Lastly, commit the transaction and try to insert the missing 30th value:
|
1 2 3 4 5 6 7 8 9 10 11 12 |
COMMIT TRAN GO BEGIN TRAN INSERT INTO PageSplit VALUES (30, 'a'); GO SELECT [database_transaction_log_bytes_used] FROM sys.dm_tran_database_transactions WHERE [database_id] = DB_ID ('PageSplitDemo'); GO |
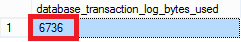
As you can see, the difference is amazing and the ratio is almost 19x! Also, keep in mind that as the data becomes smaller, the ratio becomes worse.
In order to mitigate the impact of such indexes on our environment, we need to keep an eye on the indexes that regularly end up fragmented and play with their fill factor . This can be achieved by using “sys.dm_db_index_physical_stats”. This DMF has three different execution modes:
- LIMITED – can only return the logical fragmentation of the leaf level. It examines the next level up in the index which consists of ordered list of leaf level pages’ IDs. This list needs to be compared with the allocation order of the pages to receive the fragmentation.
- SAMPLED – get the fragmentation by doing LIMITED mode check and if the number of leaf pages is above 10 000, read every 100th page, otherwise read all pages
- DETAILED – again calculate the fragmentation via DETAILED mode and read all the pages to produce all other statistics
Note that nothing comes without a price. If you are utilizing the fill factor, you are proactively reserving additional space in your indexes to lessen the impact of the extra log records that will be created with the page splits.
Many tiny transactions
We will skip the circumstances under which the log records are being flushed to disk as we already covered it in part 1. If your workload is using a lot of transactions that are processing low amount of data (for example – insert a single row), you would see a lot of small-sized log flushes. In order to have a proper log throughput, SQL Server is performing the log flushes asynchronously. There is a limitation applied in this situation: we cannot have more than 32 concurrent log flushes for a single log file. Unfortunately, we cannot circumvent this rule.
Basically we have two general cases:
- For a bad-performing IO subsystem, the number of log flushes will overwhelm the system, leading to log throughput problems
- For a well-performing IO subsystem, the limit of 32 concurrent log flushes can produce a saturation point when trying to make the transactions durable
A very counter-intuitive solution that could help in both scenarios, is to make your transactions longer (let them process larger amount of data), thus, decreasing the number of log flushes. Subsequently, for the slow IO subsystem it will always help to move your log to a faster storage but then you can face the log’s limitations. Unfortunately, if you end up there and you cannot rewrite your code to utilize longer transactions, the only solution (up to now) was to cut your workload and split it over multiple databases.
Lucky for us, we have a great new feature in SQL Server 2014 called “Delayed Durability”. It can be very beneficial in situations where we cannot rewrite our code but can tolerate a data loss. There is a great article by Aaron Bertrand on this topic and I strongly recommend checking it out: http://sqlperformance.com/2014/04/io-subsystem/delayed-durability-in-sql-server-2014
In this article we have learned that the problems with transaction logs could also originate in places other than the extra LSNs being generated. Keeping in mind the top causes for log’s throughput issues, in the next article I will focus on how we can mitigate the risk of meeting such by adhering to several configuration best practices.

In the last years, he is working on a great variety of customers' environments and involved in complex transitions and transformation projects.
Miroslav is also leading courses at Sofia University and participated as a speaker at various events.
View all posts by Miroslav Dimitrov
- How to perform backup and restore operations on SQL Server stretch databases - September 7, 2016
- SQL Server stretch databases – Moving your “cold” data to the Cloud - August 18, 2016
- Tips and tricks for SQL Server database maintenance optimization - January 11, 2016