
When a DBA is working with the SQL Server, he/she might sometimes say that the execution plan is like a black hole. As a matter of fact, though, you have to look at execution plans as weather forecasts.
In this article, I will be discussing various aspects of executions plans, types and common options.
For more information about Query optimization, see the SQL Query Optimization — How to Determine When and If It’s Needed article
Query optimization
The fundamentals of query optimization are based on the fact that SQL Server has always been a cost-based optimizer.
Cost-based optimization involves generating multiple execution plans and selecting the lowest cost execution plans to fire and finally execute a query
The CPU, IO, and memory are some of the parameters SQL Server uses in recognizing the cost and finally generating the execution plan.
What you will write against SQL Server is often totally different from what SQL Server actually executes. Hence, that is in the concept of logical query operation when compared to the physical operation which SQL Server uses.
For example, when we are talking about a logical INNER JOIN which actually gets translated physically on the execution by SQL Server as a nested loop JOIN.
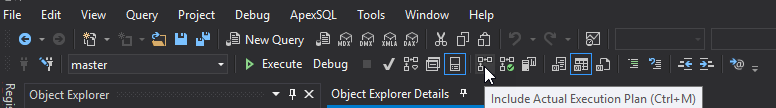
Let us execute the following query to view the concept of logical query operation. You can check the option of include actual execution plan or CTRL+M
|
1 2 3 4 5 6 7 8 |
USE AdventureWorks2014 GO SELECT * FROM [Sales].[SalesPerson] sp INNER JOIN [Sales].[SalesPersonQuotaHistory] spq ON sp.BusinessEntityID = spq.BusinessEntityID ORDER BY sp.SalesQuota GO |
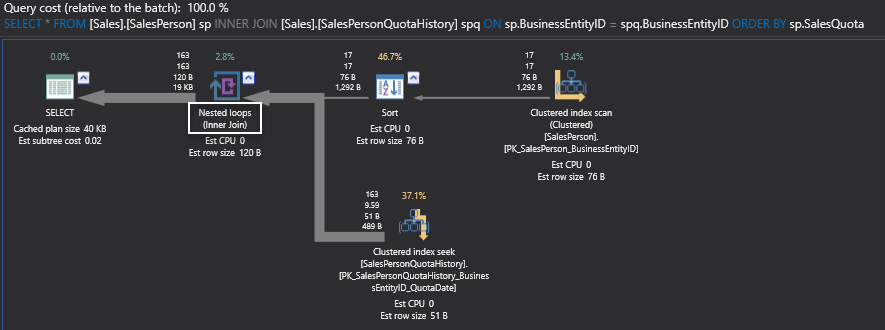
Here you can see that the physical operation involves nested loops while the logical operation includes an inner join.
Our physical operator in this particular case is the nested loop which is the actual execution mode for SQL Server, whereas the logical operation here is the inner join which is defined inside our select statement.
Finding an optimal plan
The way SQL Server ultimately determines an optimal plan is by finding the balance between what plan it wants to select and the maximizing the effectiveness of that the particular plan before the actual execution happens.
So there is a give-and-take between generating the best plan and completing the task, in a finite amount of time, before SQL Server has to step out from indefinitely going about optimizing the query plan.
SQL Server does this cost optimization and it is quite efficient in actually bringing about the best plan as fast as possible.

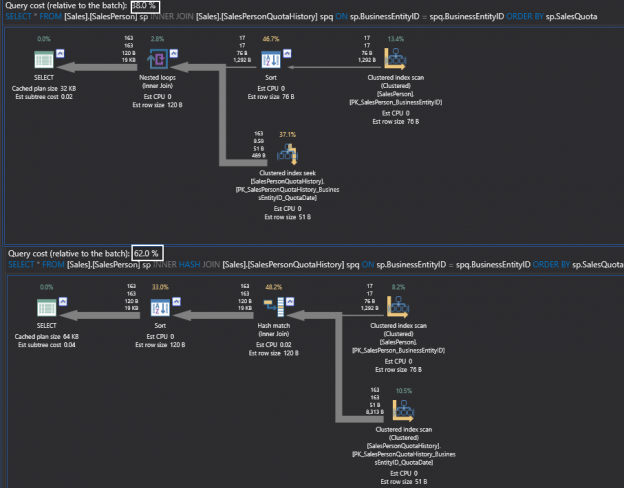
Let us check whether SQL Server chooses the optimal execution plan for the previous query or not. What we are going to do is to go ahead and explicitly state a hash join and compare execution plans.
|
1 2 3 4 5 6 7 8 9 10 11 12 13 |
SELECT * FROM [Sales].[SalesPerson] sp INNER JOIN [Sales].[SalesPersonQuotaHistory] spq ON sp.BusinessEntityID = spq.BusinessEntityID ORDER BY sp.SalesQuota GO SELECT * FROM [Sales].[SalesPerson] sp INNER HASH JOIN [Sales].[SalesPersonQuotaHistory] spq ON sp.BusinessEntityID = spq.BusinessEntityID ORDER BY sp.SalesQuota GO |
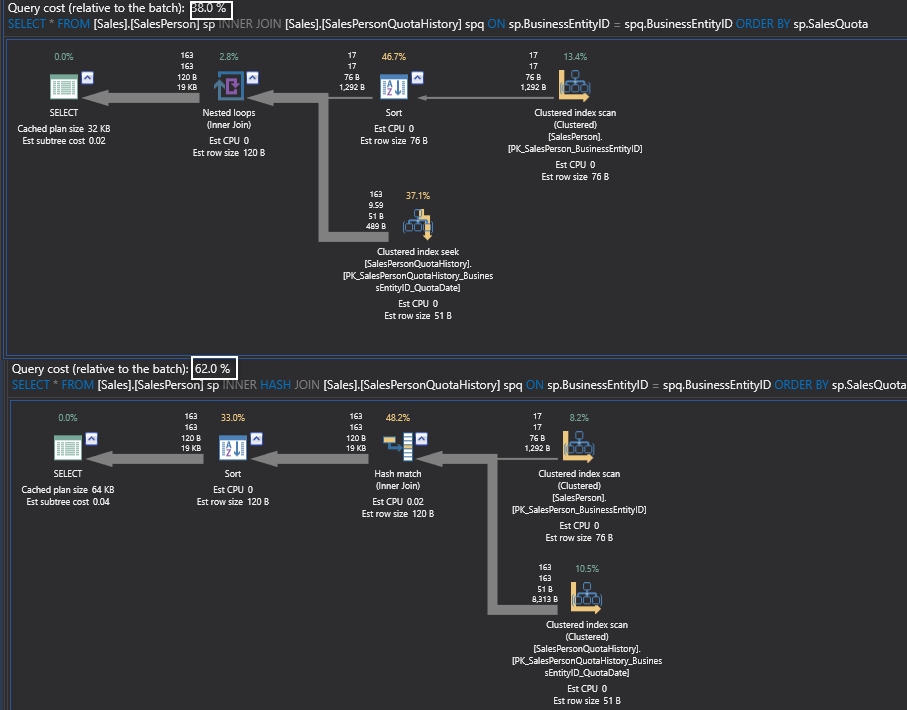
This shows that giving an explicit hint in this particular case seems to be costly.
With applying the 80-20 rule, it is advisable to leave SQL Server (cost-based optimizer) to choose which is the best and most optimal plan is.
Estimated execution plans
The estimated execution plan, for all practical purposes, uses statistics and many other parameters based on what is available on this server and generates the plan.
This is an estimated plan and not specifically the plan that has been generated by SQL Server.
This is synonymous to the first analogy that we had given about the weather forecast.
Next we’ll review various display options for estimated execution plans
SHOWPLAN_TEXT
This option is similar to the estimated graphical execution plan, as it gives you the text of the execution plan and gives you information about what the execution plan is. It does not give you any of the frills which are normally associated with the execution plan.
|
1 2 3 4 5 6 7 8 9 10 |
SET SHOWPLAN_TEXT ON GO SELECT * FROM [Sales].[SalesPerson] sp INNER JOIN [Sales].[SalesPersonQuotaHistory] spq ON sp.BusinessEntityID = spq.BusinessEntityID ORDER BY sp.SalesQuota GO SET SHOWPLAN_TEXT OFF GO |
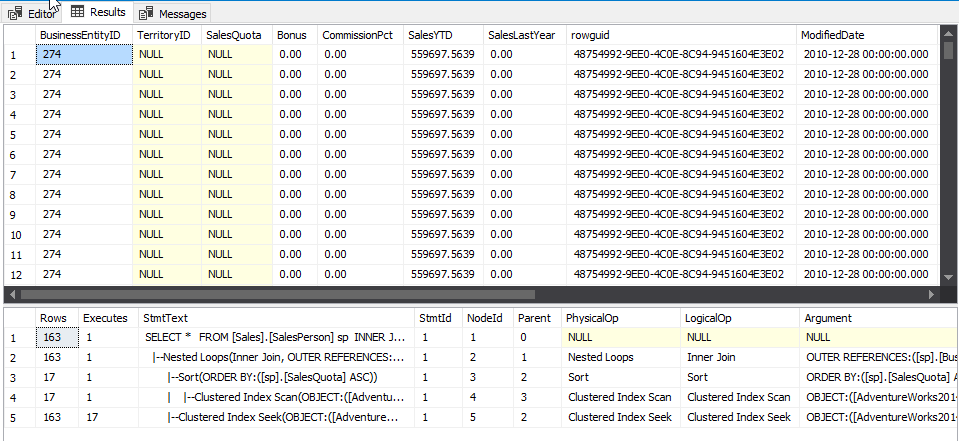
SHOWPLAN_ALL
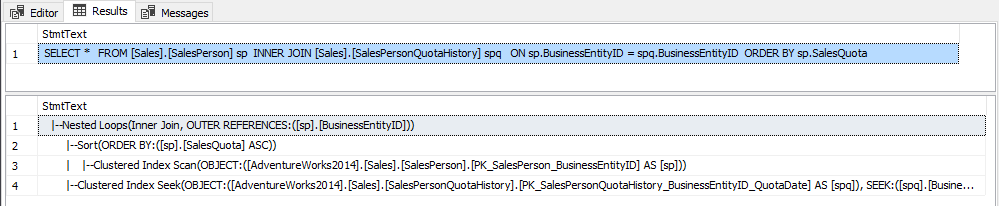
This option is similar to the estimated graphical execution plan, but has some of the additional features attached to it including the type of physical operator and type of logical operator
|
1 2 3 4 5 6 7 8 9 10 |
SET SHOWPLAN_ALL ON GO SELECT * FROM [Sales].[SalesPerson] sp INNER JOIN [Sales].[SalesPersonQuotaHistory] spq ON sp.BusinessEntityID = spq.BusinessEntityID ORDER BY sp.SalesQuota GO SET SHOWPLAN_ALL OFF GO |
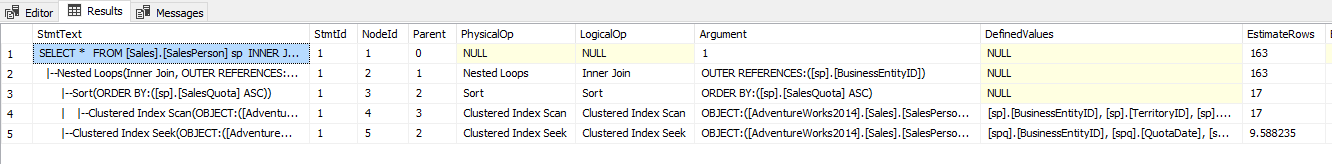
This again is the estimated execution plan; remember you did not see a result set where the actual query has been executed.
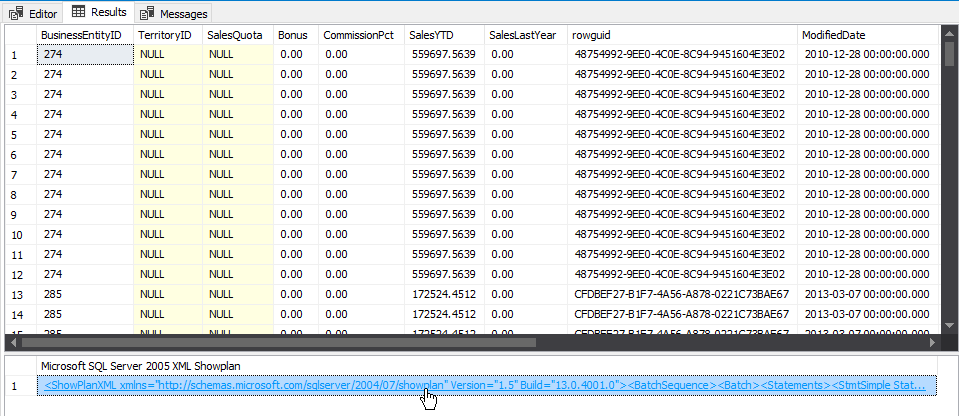
SHOWPLAN_XML
|
1 2 3 4 5 6 7 8 9 10 11 |
SET SHOWPLAN_XML ON GO SELECT * FROM [Sales].[SalesPerson] sp INNER JOIN [Sales].[SalesPersonQuotaHistory] spq ON sp.BusinessEntityID = spq.BusinessEntityID ORDER BY sp.SalesQuota GO SET SHOWPLAN_XML OFF GO |

You can see that the query plan comes in an XML format. You can look at execution plan as per estimation.
Actual execution plan
We said that the estimated execution plan is like the weather forecast, so the actual execution plan is where you can realize whether it actually rained or not.
It shows what SQL Server actually does to get the result of your query.
Here we’ll review the display options for actual execution plans
STATISTICS TIME
This option gives you the amount of time that has been spent as far as SQL Server is executing this particular query. It also provides you interesting insights into some of the information.
|
1 2 3 4 5 6 7 8 9 10 |
SET STATISTICS TIME ON GO SELECT * FROM [Sales].[SalesPerson] sp INNER JOIN [Sales].[SalesPersonQuotaHistory] spq ON sp.BusinessEntityID = spq.BusinessEntityID ORDER BY sp.SalesQuota GO SET STATISTICS TIME OFF GO |
In this particular case, the query gets executed with 163 rows and you can also see how much time of CPU that this particular query has taken and what is the actual time with respect to the execution process.
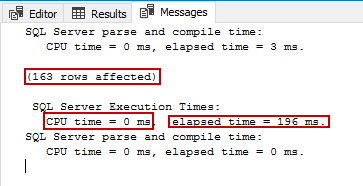
So here it states that the execution time is close to about 196 milliseconds.
If you want to know granular to what exactly the query is executing and how much of time and resources it is taking, this is one of the most ancient ways but still effective to use on any day.
STATISTICS IO
This option shows the IO characteristics. You can see that this particular query in this particular table has gone ahead and done these mini scans and these are the logical reads.
|
1 2 3 4 5 6 7 8 9 10 |
SET STATISTICS IO ON GO SELECT * FROM [Sales].[SalesPerson] sp INNER JOIN [Sales].[SalesPersonQuotaHistory] spq ON sp.BusinessEntityID = spq.BusinessEntityID ORDER BY sp.SalesQuota GO SET STATISTICS IO OFF GO |
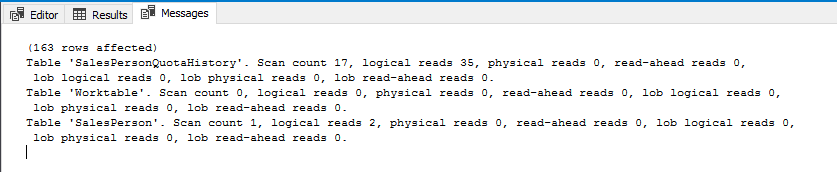
If you have scans and other mechanism hardware you will also see something which is interesting. You might also see physical reads, read-ahead reads and large object data including the reads that are associated with it.
When you have a large number of reads of a complex query, you might use these methods to actually look at which table is sending out a large number of reads and hence it is getting near the physical IO subsystem.
A physical read in this particular case shows zero because it is not getting cached. And if this value is very high that means a lot of physical IO has been happening to bring the data from the IO subsystem or your hard disk to the memory or the buffer pool.
The set statistics time on and set statistics IO on are great set operations that you can actually use to see how SQL Server goes about executing.
I have seen DBAs come back to me and say, “I can use profiler also as a mechanism to actually go ahead and look at these values”. But when you are analyzing a simple query or optimizing a simple operation, it is always handy to have these simple tools which work even from SQL Server 2000 days and these are very handy tools that give you information and insights into the query that you are playing with.
STATISTICS PROFILE
This is like SHOWPLAN_TEXT for estimated Execution plans but it retrieves the text of the actual execution plan which means that the query has already been executed.
|
1 2 3 4 5 6 7 8 9 10 |
SET STATISTICS PROFILE ON GO SELECT * FROM [Sales].[SalesPerson] sp INNER JOIN [Sales].[SalesPersonQuotaHistory] spq ON sp.BusinessEntityID = spq.BusinessEntityID ORDER BY sp.SalesQuota GO SET STATISTICS PROFILE OFF GO |
STATISTICS XML
Also likeSHOWPLAN_XML, this option shows the actual execution plan in XML format.
|
1 2 3 4 5 6 7 8 9 10 |
SET STATISTICS XML ON GO SELECT * FROM [Sales].[SalesPerson] sp INNER JOIN [Sales].[SalesPersonQuotaHistory] spq ON sp.BusinessEntityID = spq.BusinessEntityID ORDER BY sp.SalesQuota GO SET STATISTICS XML OFF GO |
Summary
Execution plans are a very important indicator for optimizing query performance. Every DBA needs to know all the details about the execution plan. I tried to be simple in discussing the very basic details for beginners. I hope this article has been informative for you.
Next article in this series:
References
- Displaying Graphical Execution Plans (SQL Server Management Studio)
- Displaying Execution Plans by Using the Showplan SET Options (Transact-SQL)
- XML Showplans

Living in Egypt, have worked as Microsoft Senior SQL Server Database Administrator for more than 4 years.
As a DBA, I design, install, maintain and upgrade all databases (production and non-production environments), I have practical knowledge of T-SQL performance, HW performance issues, SQL Server replication, clustering solutions, and database designs for different kinds of systems. I worked on all SQL Server versions (2008, 2008R2, 2012, 2014 and 2016).
I love my job as the database is the most valuable thing in every place in the world now. That's why I won't stop learning. In my spare time, I like to read, speak, learn new things and write blogs and articles.
View all posts by Ayman Elnory
- SQL Server Query Execution Plans for beginners – NON-Clustered Index Operators - April 24, 2018
- SQL Server Query Execution Plans for beginners– Clustered Index Operators - March 5, 2018
- A walk through the SQL Server 2016 full database backup - February 12, 2018