
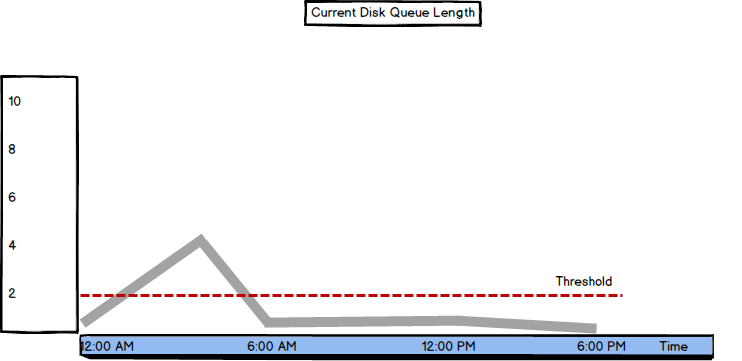
Current Disk Queue Length
“Indicates the number of disk requests that are currently waiting as well as requests currently being serviced. Subject to wide variations unless the workload has achieved a steady state and you have collected a sufficient number of samples to establish a pattern.” [1]
The metric shows how many I/O operations are waiting to be written to or read from the hard drive and how many are currently processed. If the hard drive is not available, these operations are queued and will be processed when disk becomes available. The whole disk subsystem has a single queue
The Current Disk Queue Length metric in Windows Performance Monitor is available for both physical and logical disk. In some earlier versions of Performance Monitor, this counter was named Disk Queue Length
The Current Disk Queue Length value should be less than 2 per disk spindle. Note that this is not per logical, but per physical disk. If larger, this indicates a potential disk bottleneck, so further investigation and monitoring other disk metrics is recommended. Start with monitoring %Disk Time (explained below). Frequent peaks should also be investigated
Disk array systems such as RAID or SAN have a large number of disks and controllers, which makes queues on such systems shorter. Because the metric doesn’t indicate queuing per disk, but for the whole array, some DBAs consider that monitoring Current Disk Queue Length on disk arrays is not needed
Another scenario where Current Disk Queue Length can be misleading is when data is stored in the disk cache. It will be reported as being queued for writing and thus the Current Disk Queue Length value will be higher than actual
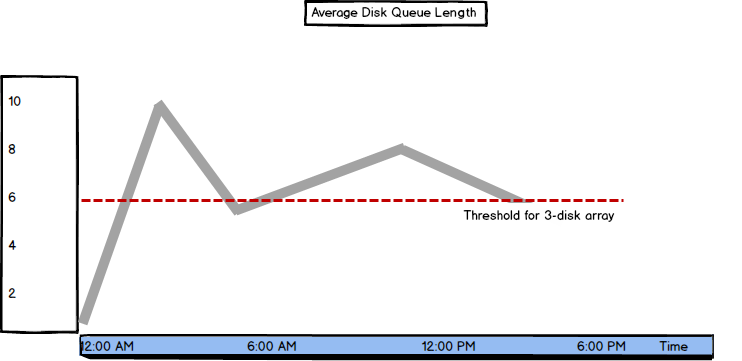
Average Disk Queue Length
The Average Disk Queue Length metric shows the information similar to Current Disk Queue Length, only the value is not current but average over a specific time period. The threshold is the same as for the previous metric – up to 2 per disk. For disk systems, the recommended value is less than 2 per individual disk drive in an array. For example, in a 6 disk array the Current Disk Queue Length value of 12 means that the queue is 2 per disk
There are two more metrics similar to Average Disk Queue Length – Average Disk Read Queue Length and Average Disk Write Queue Length. As their names indicate – they show the average queue length for operations waiting for disk to be read or written
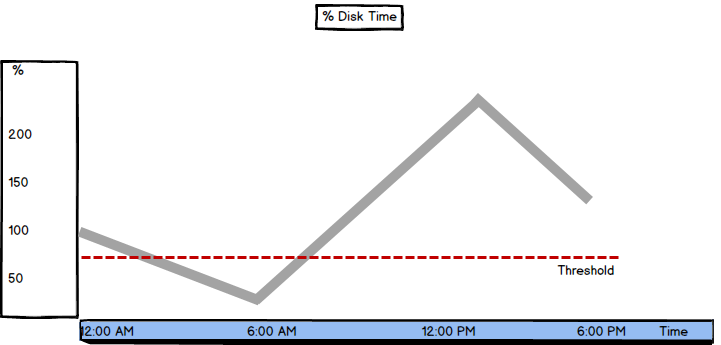
%Disk Time
“This counter indicates a disk problem, but must be observed in conjunction with the Current Disk Queue Length counter to be truly informative. Recall also that the disk could be a bottleneck prior to the %Disk Time reaching 100%” [2]
The %Disk Time metric indicates how busy the disk is servicing read and write requests, but as stated above, it’s not a clear indication of a problem, as its values can be normal while there’s a serious disk performance issue. Its value is the Average Disk Queue Length value represented in percents (i.e. multiplied by 100). If Average Disk Queue Length is 1, %Disk Time is 100%
What can be confusing is that %Disk Time values can be over 100%, which isn’t logical. This happens if the Average Disk Queue Length value is greater than 1. If Average Disk Queue Length is 3, %Disk Time is 300%, which doesn’t mean that processes are using 3 times more disk time than available, nor that there is a bottleneck
If you have a hard disk array, the total disk time for all disks is shown, without the indication of how many disks are available and what disk is having the highest %Disk Time. For example, %Disk Time equal to 500% might indicate good performance (in case you have 6 disks), or extremely bad (in case you have only 1 disk). You cannot tell without knowing the machine hardware
As this counter can be misleading, some DBAs don’t use it as there are other more straightforward and indicative metrics that show disk performance
If the value is higher than 90% per disk, additional investigation is needed. First, check the Current Disk Queue Length value. If it’s higher than the threshold (2 per physical disk), monitor if the high values occur frequently. If the machine is not used only for SQL Server, other resource-intensive applications might cause disk bottlenecks, so SQL Server performance will be suffering. If this is the case, consider moving these applications to another machine and using a dedicated machine for SQL Server only
If this is not the case, or cannot be done, consider moving some of the files to another disk or machine – archive databases, database and transaction log backups, using a faster disk, or adding additional disks to an array
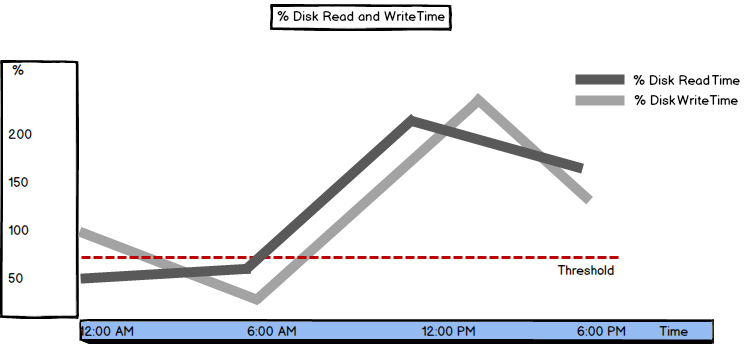
%Disk Read Time and the %Disk Write Time
The %Disk Read Time and %Disk Write Time metrics are similar to %Disk Time, just showing the operations read from or written to disk, respectively. They are actually the Average Disk Read Queue Length and Average Disk Write Queue Length values presented in percents. The values these metrics show can be equally misleading as %Disk Time
On a three – disk array system, if one disk reads 50% of the time (%Disk Read Time =50%), the other one reads 85% of the time, and the third one is idle, %Disk Read Time is 135% and Average Disk Read Queue Length 1.35. At a first glance, %Disk Read Time equal to 135% looks like a problem, but it’s not. It doesn’t mean that disks are busy 135% of the time. To get a real value, you should divide the value with the number of disks and you’ll get 136%/3 = 45%, which indicates normal performance
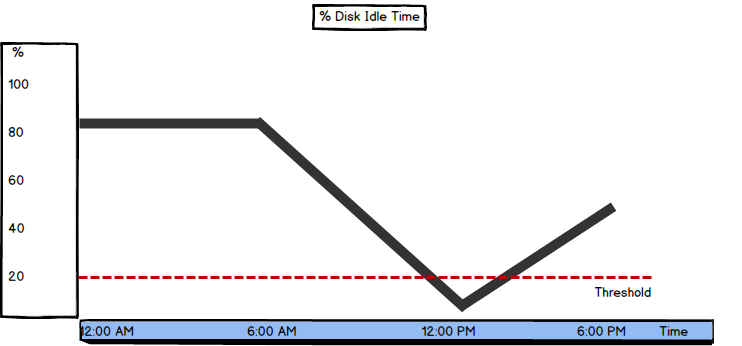
%Idle Time
The disk is idle when it’s not processing read and write requests
“This measures the percentage of time the disk was idle during the sample interval. If this counter falls below 20 percent, the disk system is saturated. You may consider replacing the current disk system with a faster disk system.” [3]
If the value is lower than 20%, disk is not able to service all read and write requests in a timely fashion. Before opting for disk replacement, check whether it’s possible to remove some applications to another machine
%Free Space
Besides Windows Performance Monitor, this metric is available in Windows Explorer in the computer and disk Properties tabs. While Performance Monitor shows the percentage of available free disk space, Windows Explorer shows the amount in GB
“This measures the percentage of free space on the selected logical disk drive. Take note if this falls below 15 percent, as you risk running out of free space for the OS to store critical files. One obvious solution here is to add more disk space.” [3]
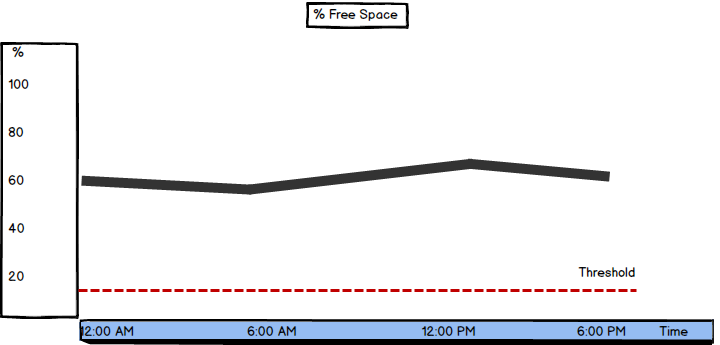
If the value shows sudden peaks without obvious reasons, further investigation is required
Unlike most of the memory and processor SQL Server performance metrics, disk metrics can be quite deceptive. They might not clearly indicate a performance problem; their values might be OK, when actually there is a serious disk issue, while their strangely high values might show normal performance, as they show values for an array of disks. Then it comes to array metrics, hardware configuration knowledge is necessary to read them correctly. Despite these disk metrics downsides, they are necessary for SQL Server performance troubleshooting

She has been working with SQL Server since 2005 and has experience with SQL 2000 through SQL 2014.
Her favorite SQL Server topics are SQL Server disaster recovery, auditing, and performance monitoring.
View all posts by Milena "Millie" Petrovic
- Using custom reports to improve performance reporting in SQL Server 2014 – running and modifying the reports - September 12, 2014
- Using custom reports to improve performance reporting in SQL Server 2014 – the basics - September 8, 2014
- Performance Dashboard Reports in SQL Server 2014 - July 29, 2014