
Disk metrics are not related only to disk itself, but to the whole disk subsystem which includes disk, the disk controller card and the I/O disk system bus. For SQL Server disk performance monitoring, it’s recommended to monitor the metrics for a while, determine the trend, and set a baseline for normal operation. Then, compare the current metric values to baselines
Most of these metrics are available in Windows Performance Monitor, where they are divided into 2 groups – Physical Disk and Logical Disk metrics. A Logical disk is a disk partition, while a physical disk is the complete physical disk with all partitions created on it. The metrics in both groups are the same, the only difference is whether they show the performance for a single partition, or for the entire disk
Some physical disk metrics might not be sufficient for deeper investigation and troubleshooting if you have more than one logical partition on a disk. This is where logical disk metrics are useful, as they show more granular results and help determining effect of SQL Server or any other application on disk performance
SQL Server uses I/O calls to perform reads and writes on a disk, it defines and manages requests for reading and writing the data, while the operating system actually performs the I/O operations. Problems with disk I/O operations are manifested through slow response times, operation time outs, and system bottlenecks
To troubleshoot SQL Server disk issues, besides total disk I/O activity, it’s recommended to monitor and detect disk activity made by SQL Server
Excessive disk using by various applications can cause SQL Server performance degradation, as SQL Server might not be the master of disk resources and would have to wait for disk reads and writes. The SQL Server activities that require disk access are creating database and transaction log backups and saving them to disk, import/export processes, jobs that read or write large amounts of data from/to disk, etc.
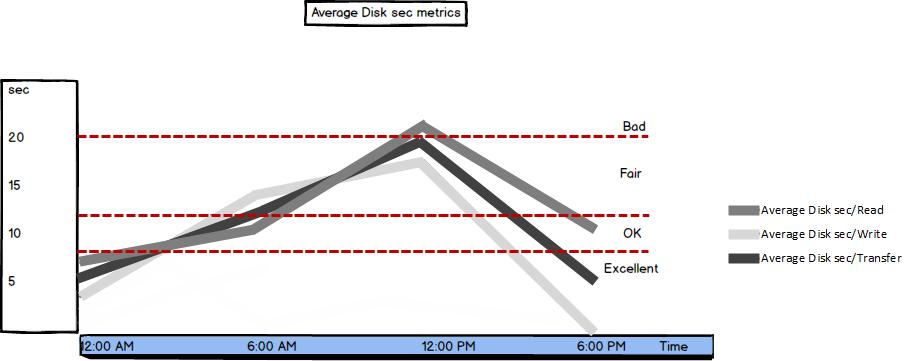
Average Disk sec/Read
The Average Disk sec/Read metric, along with Average Disk sec/Read (presented next), is one of the most important disk performance metrics. Both metrics can be tracked on logical and physical disk levels and show disk latency. The shorter the time needed to read or write data, the faster the system
“The value for this counter is generally the number of seconds it takes to do each read. On less-complex disk subsystems involving controllers that do not have intelligent management of the I/O, this value is a multiple of the disk’s rotation per minute. This does not negate the rule that the entire system is being observed. The rotational speed of the hard drive will be the predominant factor in the value with the delays imposed by the controller card and support bus system.” [1]
Average Disk sec/Read is proportional to time needed for one disk rotation. For example, a disk that makes 3,600 round per minute needs 60s/3600 = 0.016 seconds, i.e. 16 milliseconds to make one rotation. Average Disk sec/Read for that disk should be a multiple of 16 milliseconds. The time added to one disk rotation is the queuing time and the time needed for data transit across the I/O bus
The recommended Average Disk sec/Read value is below 8ms
| Value (ms) | Performance |
| < 8 | Excellent |
| 8 – 12 | OK |
| 12 – 20 | Fair |
| > 20 | Bad |
Maximum peaks during excessive I/O operations can be up to 25 milliseconds, but values constantly higher than 20 milliseconds indicate poor performance
Average Disk sec/Write
Average Disk sec/Write is another useful disk performance metric that shows the average time in seconds needed to write data to disk
Usually, the read and write speed on a disk are different. The recommended values for non-cached writes are the same as for Average Disk sec/Read. In case of cached writes, the values are very different – values higher than 4 milliseconds indicate poor performance, while the values less than 1 milliseconds indicate the best performance
| Value (ms) | Performance |
| < 1 | Excellent |
| 1 – 2 | OK |
| 2 – 4 | Fair |
| > 4 | Bad |
If the Average Disk sec/Read and Average Disk sec/Write values are constantly above the recommended values, it’s an indication of a disk bottleneck and additional analysis is required
“After you have found the disks with high levels of read/write activity, look at the read-specific and write-specific counters (for example, Logical Disk: Disk Write Bytes/sec) for the type of disk activity that is causing the load on each logical volume.” [2]
If the Average Disk sec/Read and Average Disk sec/Write values are high for all or almost all disks, the problem is most probably caused by disk communication mediums. If only a specific disk shows poor performance, the problem is most probably in disk itself
Monitoring both values can help you determine if reconfiguration of disk controller cache is needed. If for example, the Average Disk sec/Read value is significantly higher than Average Disk sec/Write, you can consider cache optimization for reading
Average Disk sec/Transfer
The Average Disk sec/Transfer metric shows disk efficiency as the average time needed for each read and write
“Measures the average time of each data transfer, regardless of the number of bytes read or written. Shows the total time of the read or write, from the moment it leaves the Diskperf.sys driver to the moment it is complete
A high value for this counter might mean that the system is retrying requests due to lengthy queuing or, less commonly, disk failures. “[3]
The recommended value is the same as for the previous two metrics
There’s no need to monitor this metric along with Average Disk sec/Read and Average Disk sec/Write, as the latter two are combined in Average Disk sec/Transfer. But if you’re monitoring Average Disk sec/Transfer and its values are higher than recommended, monitoring Average Disk sec/Read and Average Disk sec/Write is the first step in further troubleshooting
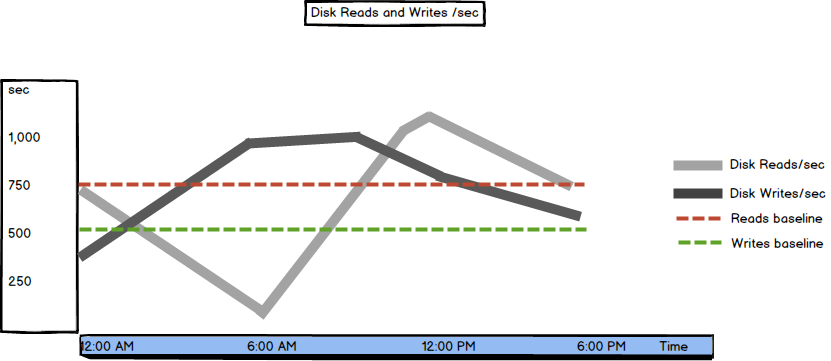
Disk Reads/sec and Disk Writes/sec
The Disk Reads/sec and Disk Writes/sec metrics show the rate of read and write operations on disk, respectively
The metric that shows the combined value of these two is Disk Transfers/sec, it’s the total number of all I/O disk requests generated in a second
If the values are low, they indicate slow disk I/O operation processing and you should check processor usage parameters and disk-expensive queries
There is no specific threshold, as it depends on disk specification and your server configuration. For an array system, the values shown are for all disks. With that said, it’s recommended to monitor these metrics for a while and to determine trends and set a baseline. Any unexpected peaks should be investigated
In this part of the SQL Server performance metrics series, we presented the most important disk performance metrics. All metrics show disk latency and if the latency is too high, the final solution is upgrading the disk subsystem, or adding more disks

She has been working with SQL Server since 2005 and has experience with SQL 2000 through SQL 2014.
Her favorite SQL Server topics are SQL Server disaster recovery, auditing, and performance monitoring.
View all posts by Milena "Millie" Petrovic
- Using custom reports to improve performance reporting in SQL Server 2014 – running and modifying the reports - September 12, 2014
- Using custom reports to improve performance reporting in SQL Server 2014 – the basics - September 8, 2014
- Performance Dashboard Reports in SQL Server 2014 - July 29, 2014