
Introduction
In order to build a SQL Server business intelligence solution one needs to:
- Design a de-normalized data warehouse
- Build and schedule an Extract, Transform and Load (ETL) package that will feed the data warehouse at regular intervals with new data from the OLTP database.
- Setup, personalize and process a cube based on the data warehouse.
- Add the processing step to the ETL schedule to ensure the whole chain is automated.
Once all these steps are considered and the OLAP cube is filled with interesting analytical data one needs to provide a way for the end-user to navigate the data in a meaningful way. There are a number of solutions available to do so in different ways. Power BI in Office 365 allows users to build their own “self-service” reports. There is similar functionality with PowerPivot and PerformancePoint if you have a SharePoint server. One can also access the OLAP cube directly in Excel using a SQL Server data source. This links your cube to a pivot table which allows users to explore the data freely.
These are all interesting approaches, the details of which are outside the scope of this article. Here we will look at the most popular and more customizable option: SQL Server Reporting Services (SSRS) reports.
It is worth noting that OLAP cubes are not read by using classic SQL queries. The language used to query OLAP cubes is called MultiDimensional eXpressions or better known as MDX. For more info on MDX visit the relevant MSDN page.
SQL Server Reporting services
An integral part of the SQL Server suite of products; SSRS comes with most versions of the product (there is a limited version provided in the Express version).
It is a platform that has a web-based interface that can be installed on a server of choice (i.e. it is not necessary to have the site on the same server as the database engine). At installation time, if one chooses to install SSRS, SQL Server will create two databases in the SQL Server instance (ReportServer and ReportServerTempDB). These are basically system databases that you do not need to touch.
Once the SSRS server is up and running you can start creating reports in SQL Server Business Intelligence Development Studio (BIDS – for older versions of SQL Server) or SQL Server Data Tools (SSDT – since 2012).
You can create reports based on many different data sources. The list is long and sufficiently extensive to cover the majority of use cases.
This article will cover the creation of reports based on OLAP cubes (of the Microsoft SQL Server Analysis Services type).
Note: If you do not have SSAS with your version of SQL Server you can make similar reports by replacing the MDX queries that point to the cube with standard SQL queries that point to the data warehouse. (It is also technically possible to query the OLTP / production database directly but this is not advised due to concurrency.
Creating an OLAP Cube report
Here are the steps to create an SSRS report based on an OLAP cube:
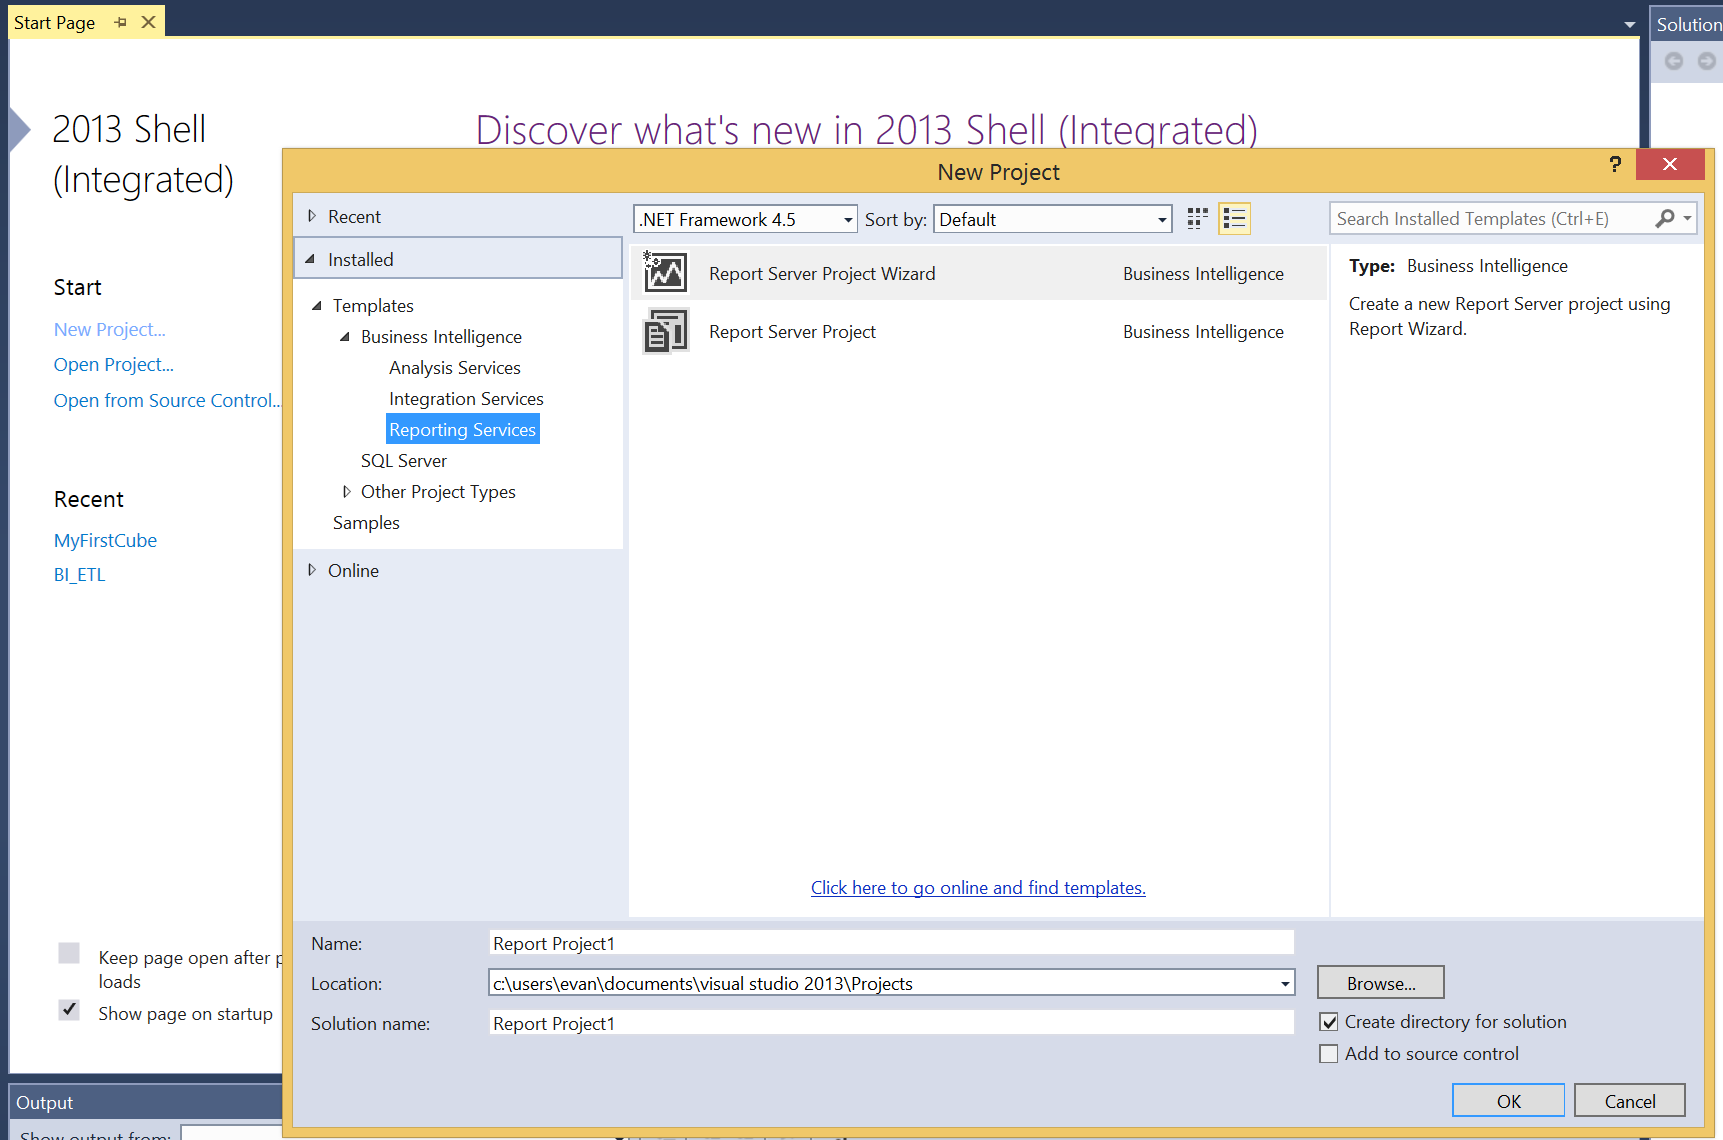
Start by opening BIDS or SSDT and clicking on “New Project…”, this will pop up the familiar project creation screen of Visual Studio. Choose Business Intelligence > Reporting Services in the left hand tree and click on “Report Server Project Wizard”:
This will open a wizard that will help you to set up your data source and create the main query that will be used by the report to fetch relevant data.
Click “Next” to pass the welcome screen.
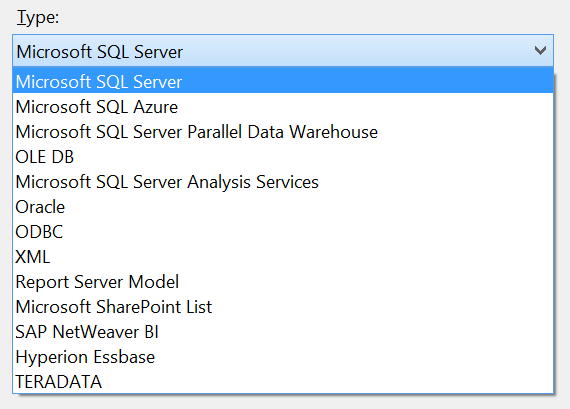
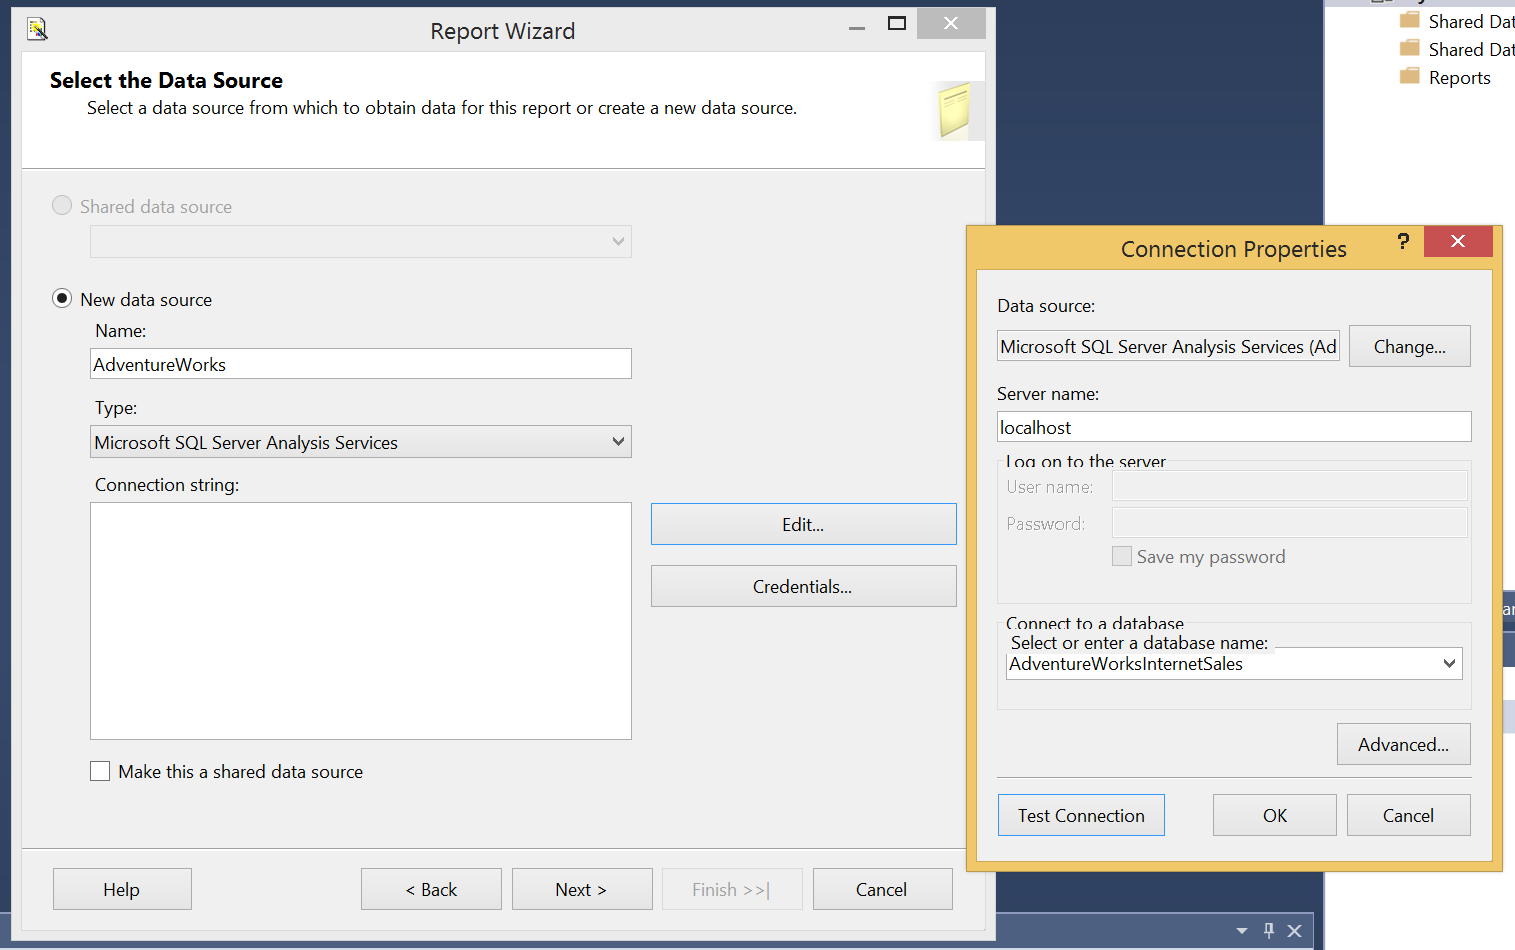
In the next screen give your data source a meaningful name (this can be an important consideration if you want to convert this source to a “shared data source” that will be used be multiple reports). Choose “Microsoft SQL Server Analysis Services” in the dropdown list and click the “Edit…” button. Fill in the server name where the OLAP cube database is stored and choose the relevant database as below (it is always reassuring to click on the “Test Connection” button before continuing to detect eventual security or network issues).
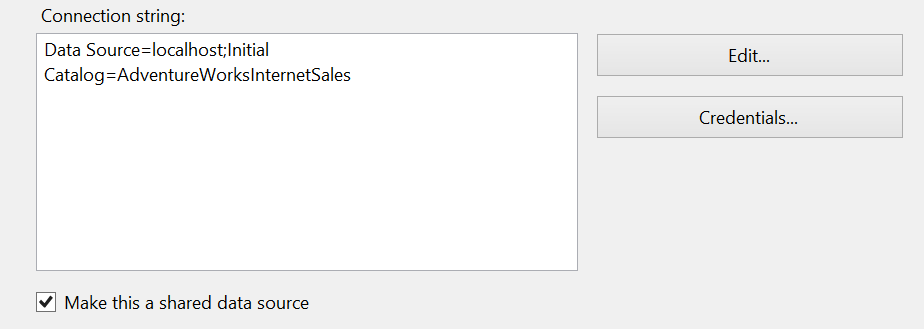
If you want to convert this to a shared data source check the check-box below the connection string then click “Next >”
On the next screen you do not have much choice but to click on the “Query Builder…” button. This is not a bad thing as the tool allows you to generate MDX queries with the aid of a friendly UI. If you were involved in the setup of the OLAP cube itself you will be familiar with the Query Designer interface. It is also accessible in SSDT cube solutions under the “Browser” tab of the “Cube” page as well as by logging into the SSAS instance of the server and right clicking on the cube database and clicking “Browse…” and is very interesting for testing purposes during the development stages.
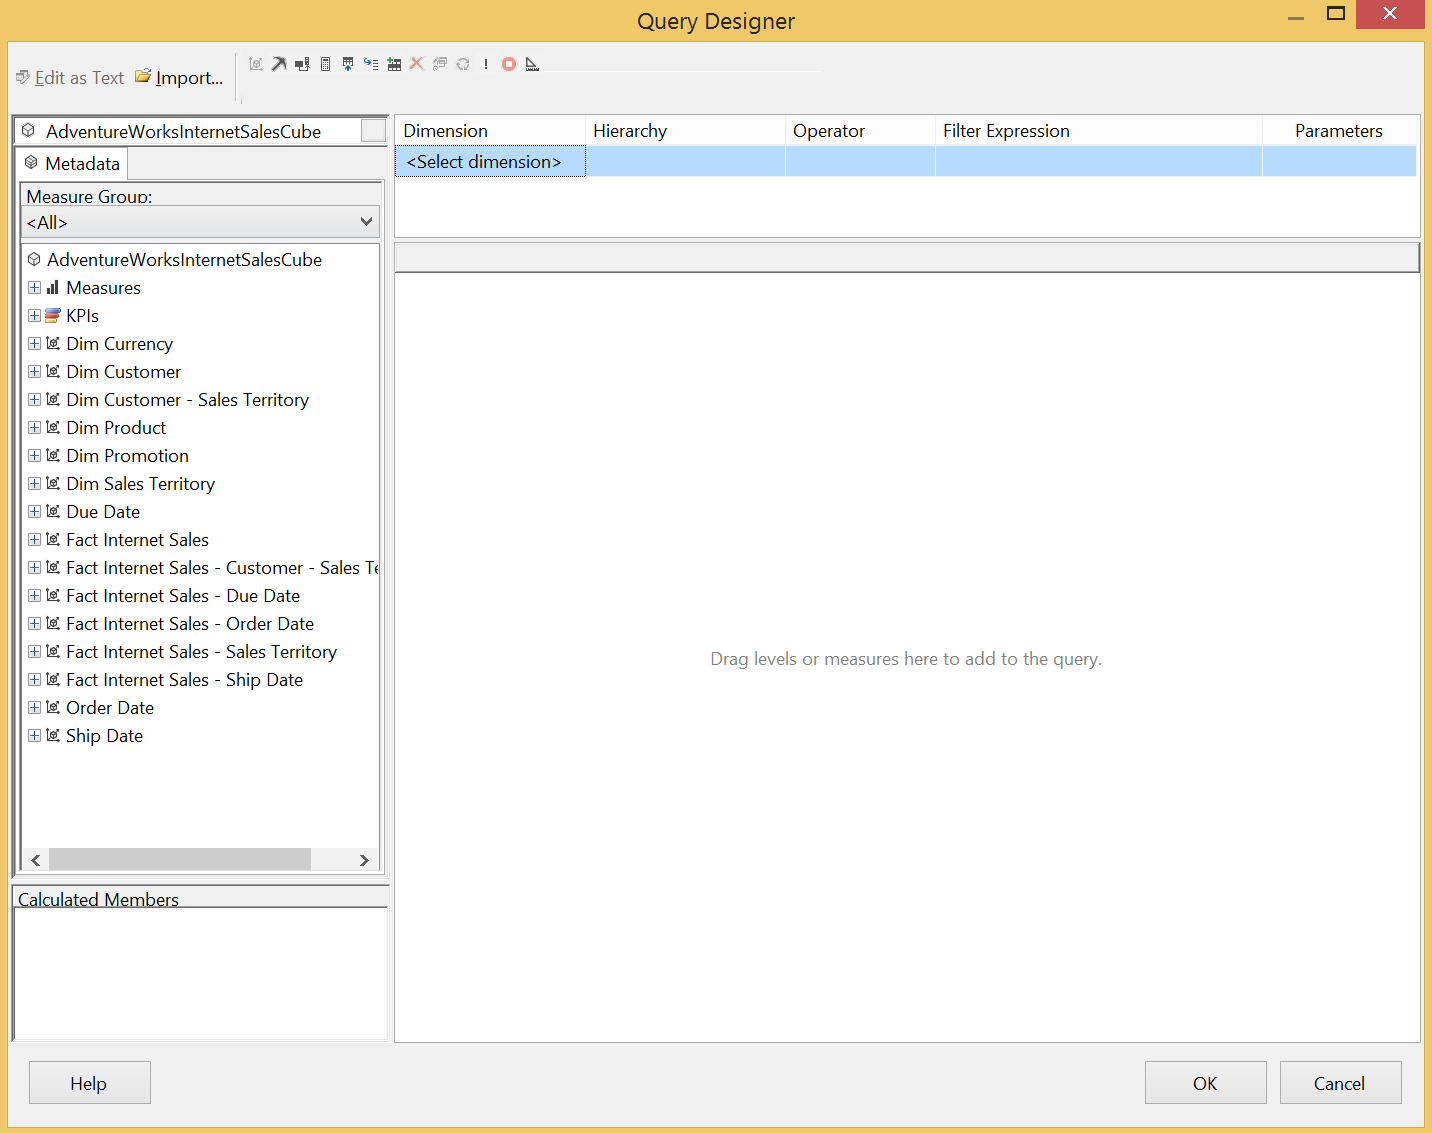
It is this screen that will help you to build the main query used for the report. Generally, the basic need here is to analyze a given measure with regards to one to many dimensions. There are two basic rules of thumb here:
- Anything that needs to be visible within the report should be dragged into the main query window
- Any dimension that needs to be used to filter the results must be made into a parameter in the upper panel.
The following screen shows a query that rolls up sales amounts by gender, country, occupation, province and yearly income. One can imagine the business value this type of information could have.
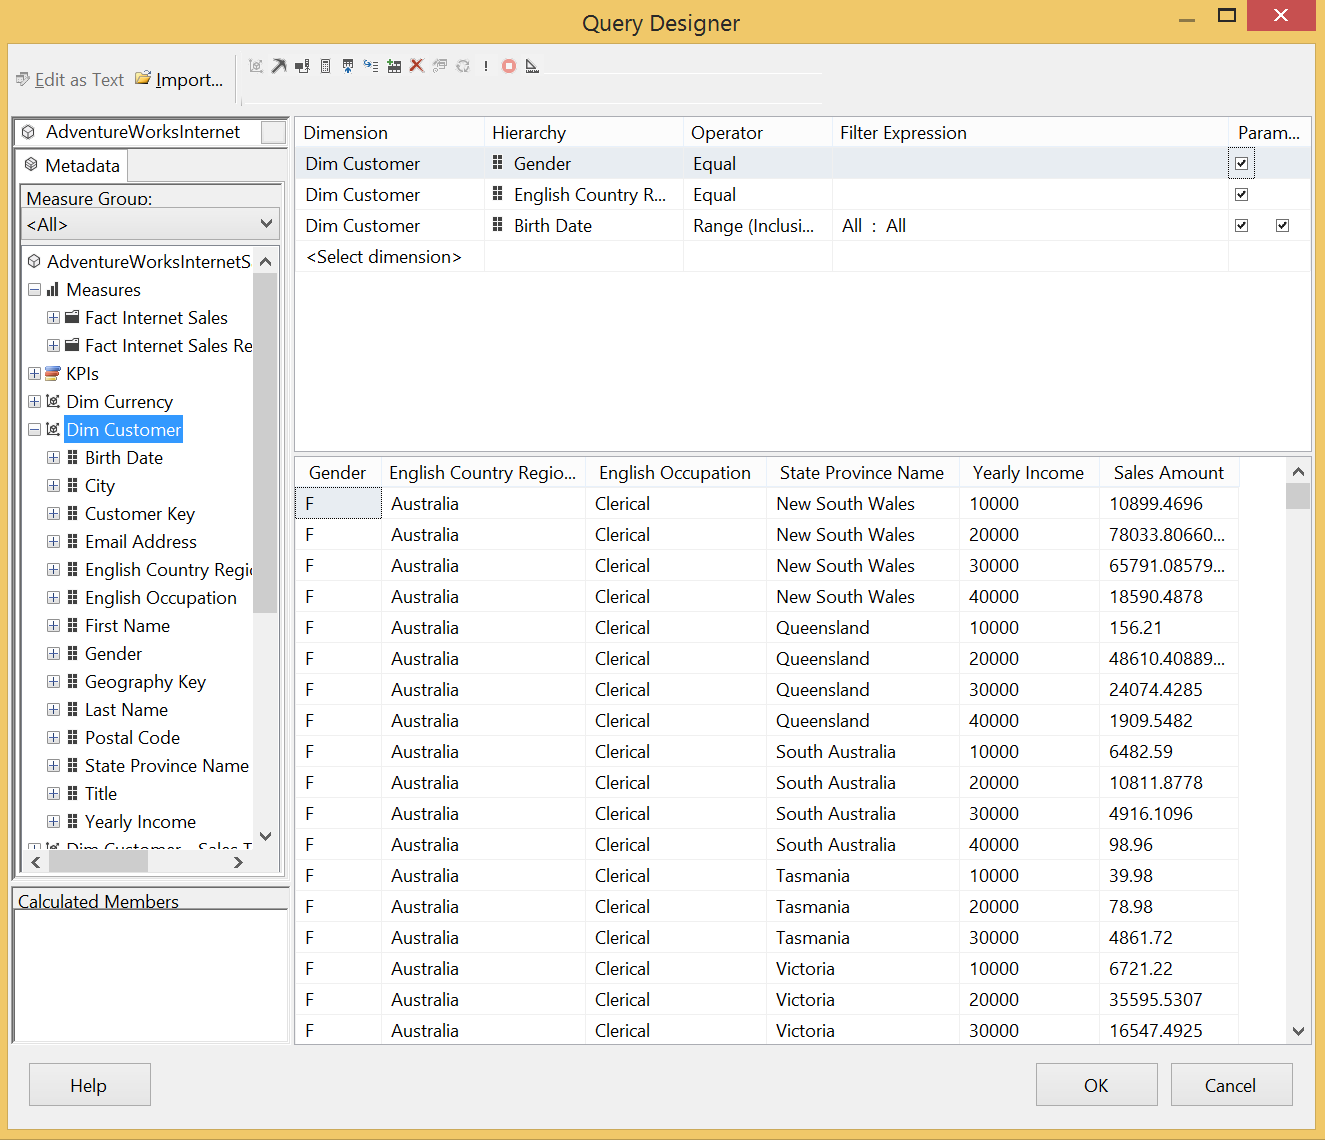
Having checked the “Parameter” check-box for each dimension the query builder will generate the MDX query for your report. The following query was generated for the data above on an OLAP cube based on the AdventureWorks data warehouse:
|
1 2 3 4 5 6 7 8 9 10 11 12 13 14 15 16 17 18 19 20 21 22 23 24 |
SELECT NON EMPTY { [Measures].[Sales Amount] } ON COLUMNS, NON EMPTY { ( [Dim Customer].[Gender].[Gender].ALLMEMBERS * [Dim Customer].[English Country Region Name].[English Country Region Name].ALLMEMBERS * [Dim Customer].[State Province Name].[State Province Name].ALLMEMBERS * [Dim Customer].[English Occupation].[English Occupation].ALLMEMBERS * [Dim Customer].[Yearly Income].[Yearly Income].ALLMEMBERS ) } DIMENSION PROPERTIES MEMBER_CAPTION, MEMBER_UNIQUE_NAME ON ROWS FROM ( SELECT ( STRTOMEMBER(@FromDimCustomerYearlyIncome, CONSTRAINED) : STRTOMEMBER(@ToDimCustomerYearlyIncome, CONSTRAINED) ) ON COLUMNS FROM ( SELECT ( STRTOMEMBER(@FromDimCustomerBirthDate, CONSTRAINED) : STRTOMEMBER(@ToDimCustomerBirthDate, CONSTRAINED) ) ON COLUMNS FROM ( SELECT ( STRTOSET(@DimCustomerGender, CONSTRAINED) ) ON COLUMNS FROM ( SELECT ( STRTOSET(@DimCustomerEnglishCountryRegionName, CONSTRAINED) ) ON COLUMNS FROM [AdventureWorksInternetSalesCube])))) CELL PROPERTIES VALUE, BACK_COLOR, FORE_COLOR, FORMATTED_VALUE, FORMAT_STRING, FONT_NAME, FONT_SIZE, FONT_FLAGS |
One can get a feel for MDX by analyzing these queries and one can see at the same time that it’s practical to have them generated for you.
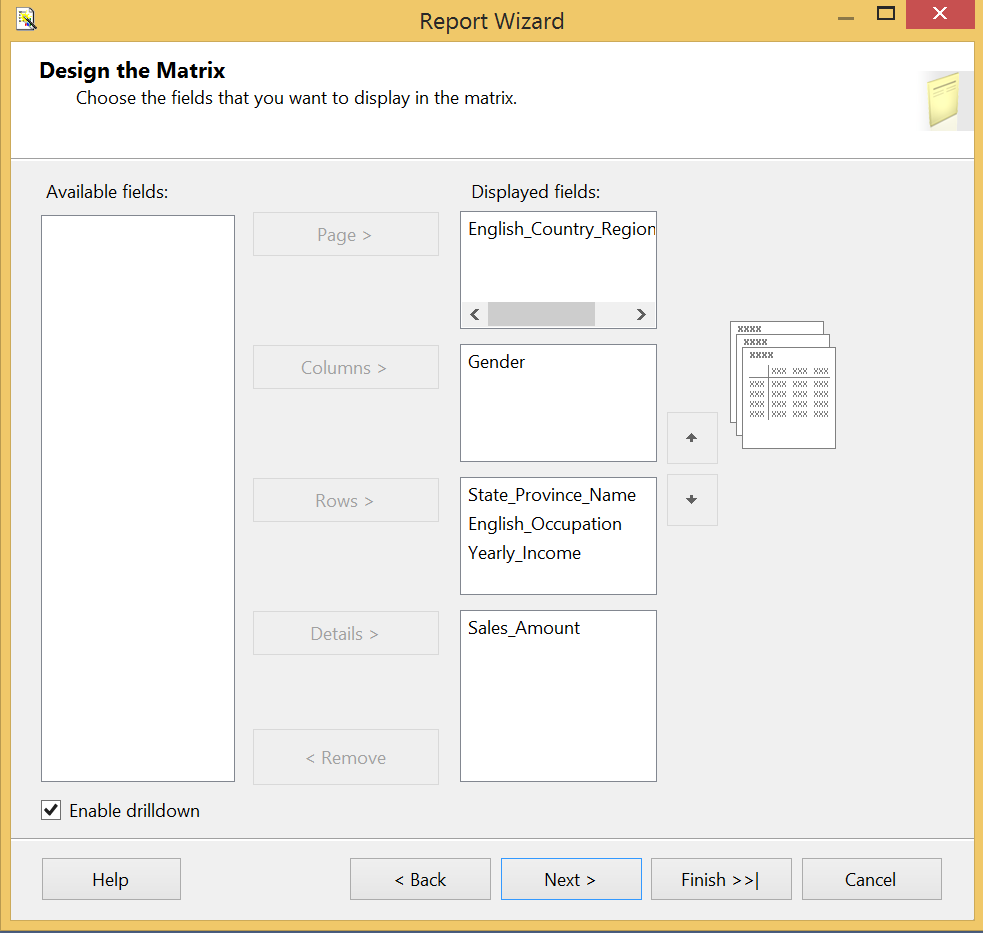
The next few pages provide a wizard to create a standard format SSRS report. The layout and grouping of the report can be changed later and if this is your plan it is not really important to spend lots of time on these steps. For this article we will be creating a basic report with a standard layout so we will choose the “Matrix” type and group in the following way:
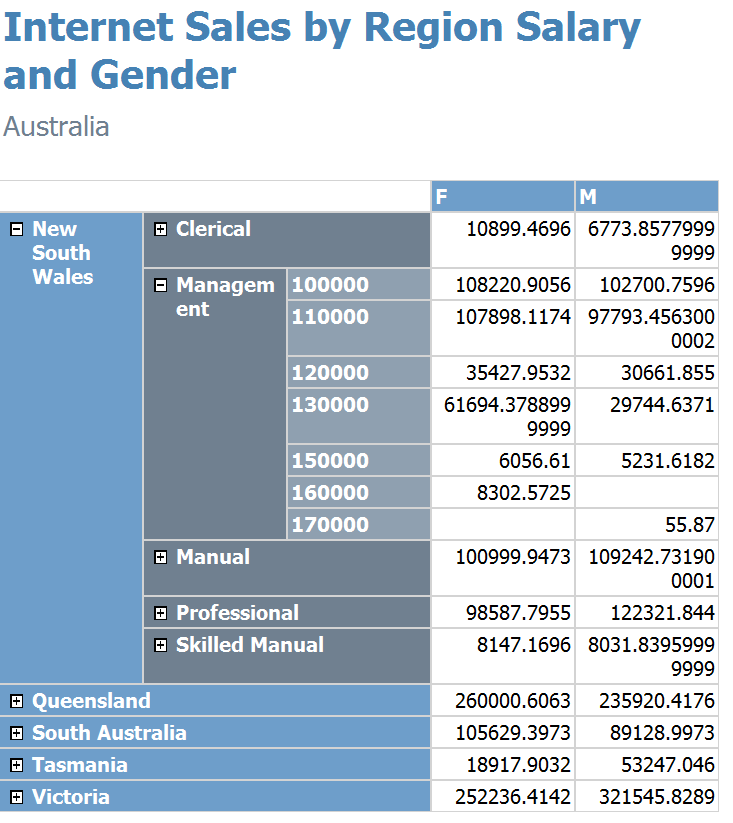
This will provide you with an interesting report divided into pages by country in which you can see the amount of sales of men and women starting at provincial leveling and drilling down to profession and eventually salary as follows:
Where to next?
Once you have built your report you can either start customizing it or deploy it as is. The practice of customization is outside of the scope of this article and will be the subject of another but suffice to mention that layout, color, images and even dynamic actions can be editing in a programming-type fashion.
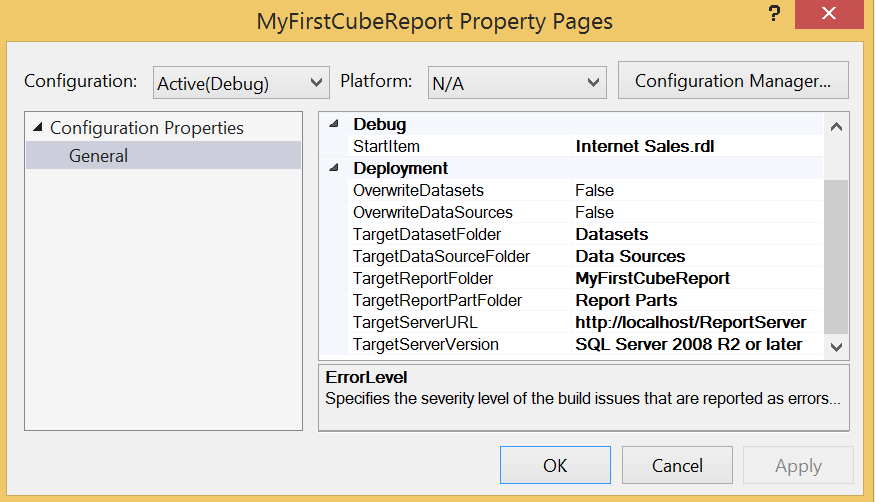
To deploy the report to your report server you can click on “Project” in the upper Data Tools toolbar and then “[YourProjectName] Properties…” and fill out where you would like your reports to deploy to. In my case, http://localhost/ReportServer is correct for the “TargetServerURL” is correct but you may need to replace that.
Once set up you can right click on the project in the Solution Explorer and choose Deploy. The report should deploy to your server and you will be able to access through the browser as an end-user would.
References:
Power BI for Office 365 – Overview and Learning
5 Reasons why PowerView can’t replace Reporting Services
MDX Query Fundamentals (Analysis Services)

View all posts by Evan Barke
- SQL Server Commands – Dynamic SQL - July 4, 2014
- SQL Server cursor performance problems - June 18, 2014
- SQL Server cursor tutorial - June 4, 2014