
SQL Server retrieves data from two areas; memory and disk. As disk operations are more expensive in terms of IO which means they are much slower SQL stores and retrieves data pages from an area known as the Buffer Pool where operations are much faster.
In order to understand how the Buffer Pool works and how it benefits our query processing we need to see it in action. Fortunately SQL Server gives us several management views and built in functionality to see exactly how the Buffer Pool is being used and how, or more importantly if, our queries are utilising it efficiently.
Firstly, we need to ensure we have a cold cache to work with; that is a Buffer Pool that is not populated with any pages. We can do this without restarting SQL Server by issuing a DBCC, or Database Console Command entitled DROPCLEANBUFFERS. Prior to doing this we need to issue a CHECKPOINT command, this ensures that any dirty pages are wrote to disk cleaning the buffers, for reference a buffer is a 8 kilobyte page residing in memory.
|
1 2 3 4 |
CHECKPOINT -- writes dirty pages to disk, cleans the buffers DBCC DROPCLEANBUFFERS -- removes all buffers |
The following message is displayed:
DBCC execution completed. If DBCC printed error messages, contact your system administrator.
As I covered in a previous post Monitoring Memory Clerk and Buffer Pool Allocations in SQL Server we can see how the Buffer Pool is allocated by using the sys.dm_os_memory_clerks Dynamic Management View:
|
1 2 3 4 5 6 7 |
--check MEMORYCLERK_SQLBUFFERPOOL allocation SELECT TOP 10 [type], SUM(pages_kb) / 1024 AS SizeMb FROM sys.dm_os_memory_clerks GROUP BY [type] ORDER BY SUM(pages_kb) / 1024 DESC |
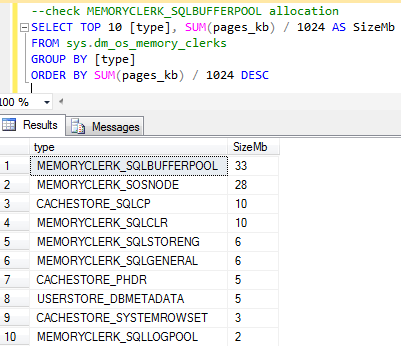
If we run this as soon as our Buffer Pool has been flushed we will see the results of our query that similar to the image below:
Here we can see some of SQL Servers current memory allocations and it’s important to understand that although we have flushed the Buffer Pool there are still other things using memory like the SQLOSNODE, CLR and storage engine clerks amongst others, in fact the Buffer Pool itself isn’t at zero but actually has a 1Mb allocation.
This is important to know because in some way it relates to our Maximum server memory setting in SQL Server (as show below).
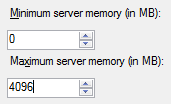
This is a screenshot from the server properties of my test instance. This setting isn’t actually the total memory that SQL is allocated, it’s just for the Buffer Pool allocation. This is why you might see SQL Servers memory usage in the likes of Windows Task Manager going above this specified limit from time to time.
To see the Buffer Pool in action we need to run some queries and its best to use a table with a relatively high row count; I’m going to use a TOP command to return 10000 rows from one of my test tables. I am also going to use the SET STATISTICS IO ON command so I can see how SQL Server is retrieving the rows.
|
1 2 3 4 |
SET STATISTICS IO ON SELECT TOP 10000 * FROM Transactions |
By clicking the Messages tab we can see how SQL has ‘read’ the data.

In this case there are 61 logical reads and 1 physical read. The logical reads are those taken from cache and the physical read is from disk. As memory is much, much faster than disk then the more logical reads the better.
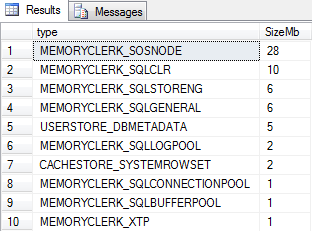
The read-ahead reads are due to an optimisation within SQL Server that pre-fetches pages from disk into cache. Now if we view the memory clerk allocations again we should see a difference in the Buffer Pool allocation.

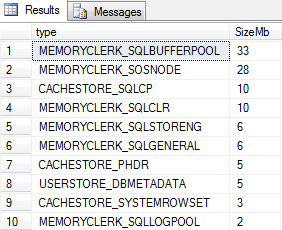
Now we can see that the MEMORYCLERK_SQLBUFFERPOOL allocation is at 33Mb and to show how this benefits our queries we’ll leave the SET STATISTICS option on and run the query once again and examine the reads:
|
1 2 3 |
SELECT TOP 10000 * FROM Transactions |

Now we can see that SQL has not had to read or pre-fetch any pages from disk, all of our pages have been read from the cache/Buffer Pool which is a much faster form of data retrieval which clearly benefits our queries. As we haven’t had to perform any further population of the Buffer Pool, we’ve re-used pages then the memory clerk allocation will remain the same.
We can see that from a cold cache our query of 10000 rows has quite naturally needed to fetch pages into the Buffer Pool via disk during execution but the key point is that the subsequent executions of the query have not used disk but have reused the stored pages.
This is a high-level example of how SQL Server has been designed to store and retrieve data efficiently utilizing the Buffer Pool.
It’s worth noting at this point that the execution times for both runs of the TOP 10000 query were identical even though we know that one has used the must faster cache and one used disk a lot more. This is down to the relatively small result set but it also shows that execution time is not really a 100% accurate way of testing a queries efficiency compared to both cost and IO statistic values.
So going back to testing, what if we change our 10000 rows query to return 50000 rows this time?

Even though it is returning 5 times the amount of rows than the previous execution we aren’t seeing any of the reads or read-ahead reads coming from disk. However, the logical reads that were 61 in our previous execution are now at 229.
To understand why the query has been able to query more rows but still use cache we need to look at our IO statistics from the very first SELECT query that we ran:

This is all because of the earlier 4104 read-ahead reads; even though the pages were not required by the original query the mechanism has still pre-fetched a larger group of pages into memory than what the original query required.
In this example it has been a huge advantage to our subsequent queries, even when returning larger result sets, as they have utilised the pre-fetched cached pages rather than having use more expensive disk read operations.
In this instance we are using very isolated testing examples and on busier systems our Buffer Pool could be under constant modification as different pages are being read into cache. This is one reason why our queries should be finely tuned with good code practice and the likes of sensible indexing so that we use the smallest amounts of rows/pages possible.
The SET STATISTICS_IO ON option is a great way to see how our queries are utilising Buffer Pool or physical IO operations. If we see high disk usage then we know there may be an opportunity for tuning or that there may be instance level reasons why the Buffer Pool is not being used as efficiently as it could be.

He has over 10 years experience working with SQL Server in different roles such as DBA, Database Developer and BI specialist. He has worked as Technical Lead on numerous mission critical projects in various sectors such as local government, finance, charities and retail.
David is extremely passionate about SQL Server and keeps his own blog at http://sqlclarity.blogspot.com/ where he shares his views on the Data Platform. In his spare time he loves spending time with his family, watching movies and cooking Asian cuisine!
View all posts by David Alcock
- Monitoring SQL Server with Dynamic Management Objects – Requests - May 17, 2017
- Monitoring SQL Server with Dynamic Management Objects – Sessions and connections - May 12, 2017
- CHECKSUM page verification in SQL Server - March 21, 2017