
The following article applies to SQL Server versions 2008 +
Adequate memory is one of the most important factors for a well-functioning instance of SQL Server. By design SQL Server manages its own memory allocations via the SQLOS rather than having the servers Operating System perform this task.
Therefore it’s safe to say that monitoring SQL Servers memory use is a very important administrative task and in this post I am going to show you how to use Dynamic Management Views to take a closer look at how SQL is using memory and how these benefit troubleshooting activities.
Before we do that we need to see how much memory is on our server and how much is allocated to be used by SQL itself. This relates to the very first paragraph in this post, the difference between total memory and SQL memory is allocated to the operating system and how much that should be is really dependent on the total memory in the server. I have always started with a setting of 4Gb or 10% of the total memory, whichever is more and tested regularly.
To view the total server memory use the following query against the sys.dm_os_sys_memory DMV:
|
1 2 3 4 |
SELECT total_physical_memory_kb / 1024 AS MemoryMb FROM sys.dm_os_sys_memory |
To view SQLs allocation we can query the sys.configurations table to see how SQL has been configured:
|
1 2 3 4 |
SELECT name, value_in_use FROM sys.configurations WHERE name LIKE 'max server memory%' |
This is an incredibly important setting for SQL Server because its default value at installation can cause performance problems. The reason is SQLOS and by default it will be allocated all of the RAM in the server and will dynamically release memory back to the Operating System by monitoring a memory thread. Whilst that is all well and good we can avoid this release of memory entirely be sensibly capping SQL Servers memory.
It’s also worth noting what else is running on your server. I’m a huge advocate of having dedicated SQL instances without anything else running on them and that applies to items like Analysis, Integration or Reporting services too. Whilst that is perfectly good advice it isn’t always possible for a number of reasons but again just make sure you have adequate resource.
A common misconception is that the maximum server memory setting applies to all of SQL Server, it doesn’t and its quite common to see, at the server level, SQL Server using more memory than this setting allows. The reason for this is that the configuration item only applies to the SQL Buffer Pool and various other components within SQL can consume more memory but it must be said that the Buffer Pool is mainly the biggest item of SQL memory allocation.
To see how SQL is using memory internally we can query the sys.dm_os_memory_clerks DMV to view currently active memory clerks within SQL Server. A memory clerk sits between memory nodes and the memory components within SQL Server. Each component has its own memory clerk that interfaces with the memory nodes to allocate memory; these clerks can then be used to track resource consumption. This architecture also means that threads cannot directly interface with the low level memory allocators but must go to the clerks for memory requests.
The test instance that will use has16Gb of RAM in the Server and I have allocated 8Gb to SQL Server, by running the following query I can see the top 5 memory consumers by clerk type and see how much they are using.
|
1 2 3 4 5 6 7 |
SELECT TOP(5) [type] AS [ClerkType], SUM(pages_kb) / 1024 AS [SizeMb] FROM sys.dm_os_memory_clerks WITH (NOLOCK) GROUP BY [type] ORDER BY SUM(pages_kb) DESC |
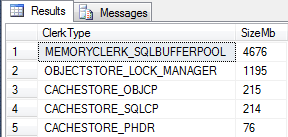
As I would expect the Buffer Pool is the largest consumer of memory within the instance with just over 4.5Gb allocated. The lock manager is next with just over 1Gb allocated for lock resources and the remaining clerks relate to allocations for the query plan. The CACHESTORE_OBJCP allocation refers to plans for stored procedures and functions. The CACHESTORE_SQLCP are plans not within those object types and refer to statements executed directly against SQL Server whilst the CACHESTORE_PHDR row shows algebrized trees for various objects.
On a busy SQL Server this information is really useful for us to capture at regular intervals so we can closely monitor memory allocation under normal workloads. If we were to experience performance problems where we suspect memory pressure we can repeat the query to see if memory is being allocated differently.
As an example here’s the same query taken when a full database consistency check is being ran against one of my test databases. We can see here that there’s a new memory clerk that is now in our top 5 allocations list, this particular clerk, SQLQERESERVATIONS is related to Memory Grant allocations within SQL Server.
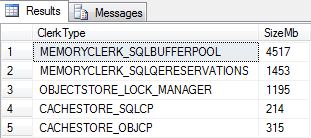
Upon seeing the SQLQERESERVATIONS we can query the current memory grants using the sys.dm_exec_query_memory_grants DMV and by using the CROSS APPLY function to sys.dm_exec_sql_text we can return the query text that is associated with the process.
|
1 2 3 4 5 6 |
SELECT session_id, requested_memory_kb / 1024 as RequestedMemMb, granted_memory_kb / 1024 as GrantedMemMb, text FROM sys.dm_exec_query_memory_grants qmg CROSS APPLY sys.dm_exec_sql_text(sql_handle) |
The query returns the following single result and with only one process running we know the consistency check has had a direct effect on our memory allocations.
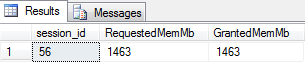
Here’s the query text:
|
1 2 3 4 5 6 7 8 9 10 11 12 |
DECLARE @BlobEater VARBINARY(8000) SELECT @BlobEater = CheckIndex (ROWSET_COLUMN_FACT_BLOB) FROM { IRowset 0xF022EAB907000000 } GROUP BY ROWSET_COLUMN_FACT_KEY >> WITH ORDER BY ROWSET_COLUMN_FACT_KEY, ROWSET_COLUMN_SLOT_ID, ROWSET_COLUMN_COMBINED_ID, ROWSET_COLUMN_FACT_BLOB OPTION (ORDER GROUP) |
This is one example of how a resource intensive process can affect the internal memory allocations within SQL Server but what about monitoring the allocations within the Buffer Pool itself?
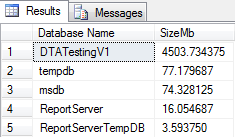
For that we use the sys.dm_os_buffer_descriptors DMV to see memory allocation broken down by database. Similar to the memory clerk view it is incredibly useful to capture and record this information at regular intervals and observe significant changes from what you have observed as “the norm”.
|
1 2 3 4 5 6 7 |
SELECT TOP 5 DB_NAME(database_id) AS [Database Name], COUNT(*) * 8/1024.0 AS [Cached Size (MB)] FROM sys.dm_os_buffer_descriptors WITH (NOLOCK) GROUP BY DB_NAME(database_id) ORDER BY [Cached Size (MB)] DESC OPTION (RECOMPILE); |
Here are the results on a test instance:

I like to record the results of this query at regular intervals taking note of database memory allocations at various points during the working day or when intensive activities or maintenance is being undertaken. The key is understanding how SQL is working so that once these baseline values have been captured we can compare back to them during troubleshooting to see if any databases are utilising (or have been allocated) memory differently.
By capturing memory clerk and buffer descriptor usage we can build a picture of how SQL is working under normal workloads. It also means we have this information readily available to us should we need to highlight issues and the effect that they are having on the system.

He has over 10 years experience working with SQL Server in different roles such as DBA, Database Developer and BI specialist. He has worked as Technical Lead on numerous mission critical projects in various sectors such as local government, finance, charities and retail.
David is extremely passionate about SQL Server and keeps his own blog at http://sqlclarity.blogspot.com/ where he shares his views on the Data Platform. In his spare time he loves spending time with his family, watching movies and cooking Asian cuisine!
View all posts by David Alcock
- Monitoring SQL Server with Dynamic Management Objects – Requests - May 17, 2017
- Monitoring SQL Server with Dynamic Management Objects – Sessions and connections - May 12, 2017
- CHECKSUM page verification in SQL Server - March 21, 2017