
In the previous two articles, we’ve practiced SQL queries and went through a few more examples. Today we’ll use SQL queries and create a report from scratch. We’ll start from the simplest possible query and finish with the query returning the actual report data.
Data Model & a few general thoughts
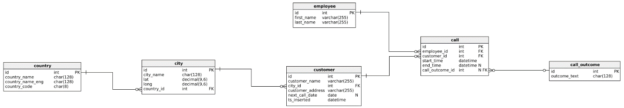
As always, we’ll have to take a look at the data model we’re using. If you’re a data analyst, some of the expected tasks you can expect are – grab the data from the database, create a report, draw conclusions from the report data. Therefore, you can expect that you’ll have a data model at your disposal.
In such a data model, you should identify the tables that contain data needed in the report. Also, you’ll need to be sure how these tables are related. You should ask yourself questions like:
- Which tables are dictionaries and which ones are being populated with data (either by users/customers, either some automated process)? -> You’re interested in analyzing data from tables being populated with the data while dictionaries are here to display info on the screen (when the data is being inserted + used a category in reports)
- Does table X always have a related record in table Y? -> Maybe there always is a record in the related table, but that doesn’t need to be the case always. This will be important when you decide to use INNER JOIN (if you always have a related record) or LEFT JOIN (if you don’t always have a related record) when joining these two tables
In this article, we’ll use data from only 3 tables: employee, customer, and call.
The goal of this article is to create a report with all pairs of employees and customers and the number of calls each employee and customer had. We should also return a pair where there were no calls and have 0 as a value in the related column.
#1 SQL Example – Check data
We’ll start with the two simple SQL queries to check what is on our tables (employee & customer). These are two tables we’ll need to create all our reporting categories (we need all combinations of employees and customers).
|
1 2 3 |
-- check tables data SELECT * FROM employee; SELECT * FROM customer;</p> |
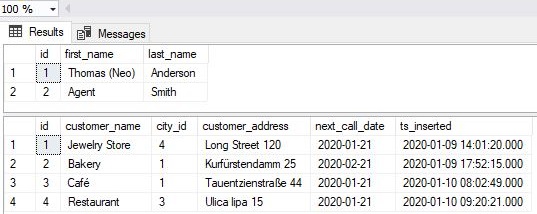
I guess there is no need to explain SQL queries or their results.
There are only 3 things worth mentioning here:
- Since we need all pairs in the final report, we’ll need to have 8 report categories (2 employees * 4 customers = 8 different pairs)
- Our tables are small and have only a few rows. Therefore, we could easily list all our employees and customers. In real-world scenarios, when you’ll need to create a report (and reporting categories), you can expect a significantly larger number of values in the tables used to create reporting categories. In that case, you could limit the result to see only, e.g., TOP 10 rows, and COUNT rows in all tables included (number of rows in the 1st table * number of rows in the 2nd table = total number of reporting categories)
- Both tables used to create categories are not actual catalogs/dictionaries, but lists. Still, we don’t expect data changes in these tables as often as in other tables
#2 SQL Example – Create reporting categories (Cartesian product)
We now know what is in our tables, and are ready to create reporting categories. Since we need to combine all rows from one table with all rows from another table, we’ll create a Cartesian product of these two tables. We can do it simply, and we’ll show 2 common ways to do that.
|
1 2 3 4 5 6 7 8 9 10 11 12 13 14 15 16 17 18 19 20 |
-- creating reporting categories using the Cartesian product -- 1. Cartesian product without joins SELECT employee.id AS employee_id, employee.first_name, employee.last_name, customer.id AS customer_id, customer.customer_name FROM employee, customer; -- 2. Cartesian product using CROSS JOIN SELECT employee.id AS employee_id, employee.first_name, employee.last_name, customer.id AS customer_id, customer.customer_name FROM employee CROSS JOIN customer; |
Let’s take a look at the result. As expected, both SQL queries returned all combinations, in total, 8 of them.
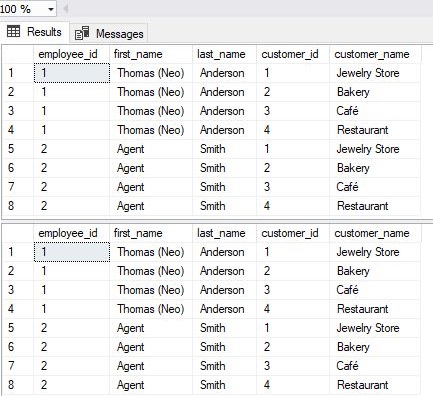
The first query did that without using JOIN, while in the 2nd query, we’ve used CROSS JOIN.
For the first query, the important thing to mention is that we wanted a Cartesian product. Therefore, we’ve just listed tables, and haven’t used any join condition in the WHERE part of the query. We did it here with a purpose. Still, in most cases, you want to relate tables using a join condition, and the Cartesian product is the result of an error (not using the condition). I use the Cartesian product only in situations similar to this one (when I need to create a report and report categories).
The second query used the CROSS JOIN. This is very useful if you plan to add a few more tables to your query using any other JOIN (especially LEFT JOIN) because you can simply continue to add joins after this one.
#3 SQL Example – Get report data
The next step in creating a report is to grab the actual data we need. In our case, we want to count all contacts employees had with customers. We’ll simply use ids from both tables, group by them, and count the number of calls. You can read more about aggregate functions (including COUNT), here.
|
1 2 3 4 5 6 7 8 9 10 11 |
-- get report data SELECT employee.id AS employee_id, customer.id AS customer_id, COUNT(call.id) AS calls FROM employee INNER JOIN call ON call.employee_id = employee.id INNER JOIN customer ON call.customer_id = customer.id GROUP BY employee.id, customer.id; |
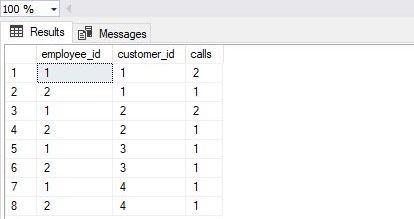
Our query returned all pairs of employee_id and customer_id that have at least 1 call. In our case, due to the data in our database, each employee and customer had at least 1 call, and therefore the final result has 8 rows. Still, this happens only to the nature of data in our database and other scenarios; you could easily have, e.g., only 5 pairs returned as the result of this query.
#4 SQL Example – Combine categories & report data
The last thing we need to do in order to create a report is to combine reporting categories with the report data. We’ll simply use SQL queries created in “#2 SQL Example – Create reporting categories (Cartesian product)” and “#3 SQL Example – Get report data”.
We’ll use both these SQL queries as a subquery for the main query. Notice that these subqueries act as “standard” tables, so you can look at them as on black boxes. And what is in these tables? Well, they “contain” the results queries created in the previous 2 parts returned.
|
1 2 3 4 5 6 7 8 9 10 11 12 13 14 15 16 17 18 19 20 21 22 23 24 25 26 27 28 29 30 31 32 33 34 35 |
SELECT report_categories.employee_id, report_categories.first_name, report_categories.last_name, report_categories.customer_id, report_categories.customer_name, report_data.calls FROM ( -- report categories SELECT employee.id AS employee_id, employee.first_name, employee.last_name, customer.id AS customer_id, customer.customer_name FROM employee CROSS JOIN customer ) report_categories LEFT JOIN ( -- report data SELECT employee.id AS employee_id, customer.id AS customer_id, COUNT(call.id) AS calls FROM employee INNER JOIN call ON call.employee_id = employee.id INNER JOIN customer ON call.customer_id = customer.id GROUP BY employee.id, customer.id ) report_data ON report_categories.employee_id = report_data.employee_id AND report_categories.customer_id = report_data.customer_id; |
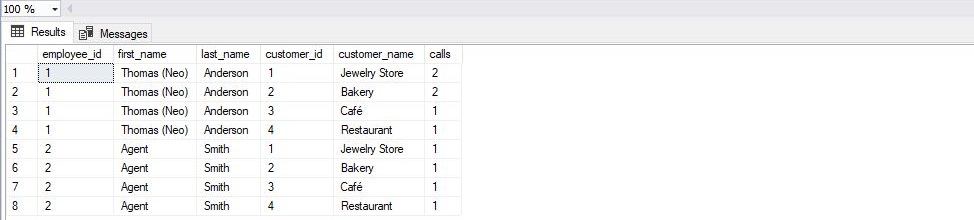
Let’s spend some time and comment on the result returned:
- We’ve used previously created 2 SQL queries as subqueries. I’ve just copy-pasted them, put them inside “(“ and “)” and gave them alias names – report_categories and report_data. Now, I’ll treat them like any other table with column names as defined within these SQL queries
- These two subqueries (tables) are joined using LEFT JOIN. This is very important because we need all categories returned in the final result. In case there is no related report data for a category, we’ll still have our category in the final result, and we’ll see that this pair of the employee and customer had no calls
- When joining, I’ve joined by 2 criteria – employee_id and customer_id. This is needed because this pair is a unique value on both sides (remember when we’re joining tables, we’re using primary and foreign keys)
Please show the “Save SQL Query results to Excel” part here.
Note: When you need to create a report, always have in mind, what information business users need to make a decision, so be sure you’ve checked report requirements with them first.
In our example, we wanted to have all possible categories, regardless of the fact if they have related value or not. That is usually the case when you want to see that there was no performance in a certain category. In case there is no category in the report, a business user might not even be aware there is such a category and couldn’t make necessary business decisions.
Conclusion
To sum up, we’ve created a report from scratch. While we started with a very simple query, the final query displays more relevant business information. I suggest that you apply this procedure each time you need to create a report, at least when you’re creating a complex one.
In the upcoming articles, we’ll go a few more steps further and show how to work with dates & time functions, how to combine SQL query results with Excel, and also how to create pivot tables directly in SQL Server.
Table of contents

His past and present engagements vary from database design and coding to teaching, consulting, and writing about databases. Also not to forget, BI, creating algorithms, chess, philately, 2 dogs, 2 cats, 1 wife, 1 baby...
You can find him on LinkedIn
View all posts by Emil Drkusic
- Learn SQL: How to prevent SQL Injection attacks - May 17, 2021
- Learn SQL: Dynamic SQL - March 3, 2021
- Learn SQL: SQL Injection - November 2, 2020