
The graph database is a critically important new technology for data professionals. As a database technologist always keen to know and understand the latest innovations happening around the cutting edge or next-generation technologies, and after working with traditional relational database systems and NoSQL databases, I feel that the graph database has a significant role to play in the growth of an organization. Not only are traditional database systems generally inefficient in displaying complex hierarchical data, but even NoSQL lags a little. We usually see a degradation in performance with the number of levels of relationship and database size. Also, depending on the relationship, the number of joins may increase as well.
There are many workaround ways to display the relationship (such as using Recursive CTE) but that’s still a workaround. Having said that, the SQL graph feature is really capable of drilling through many levels of relationships with ease. The design of the model and the execution of query has made the process much simpler and seamless, and thereby, efficient. The amount of coding has been brought down significantly.
The graph database is an expressive language for representing complex database management systems. This technology already has a strong footprint in the IT industry. It has the capability to influence various fields such as social networking, fraud detection, IT network analysis, social recommendations, product recommendation, and content recommendation.
The SQl graph feature is suited in scenarios where data is more interconnected and has strongly defined relationships.
Overview
A graph is composed of two elements: a NODE (vertices) and an EDGE (relationship). Each node represents entities, and the nodes are connected to one another with edges; these provide details on the relationship between two nodes with their own set of attributes and properties.
The graph database can be defined as the data structure representation of an entity modeled as graphs. It is derived from the graph theory. The data structures are the Node and the Edge. The attributes are the properties of the node or the edge. The relationship defines the interconnection between the nodes.
Relationships are prioritized in graph databases, unlike other databases. Therefore, no data inference using foreign keys or out-of-band processing is needed. We can build sophisticated data models simply by assembling abstractions of nodes and edges into a structure. Given the priority for relationships over data, the development stack receives the biggest value here.
In today’s world, relationship modeling requires more sophisticated techniques. SQL Server 2017 offers graph capabilities to model relationships. Graph DB has nodes and edges—two new table types NODE and EDGE. And a new TSQL function called MATCH(). The Node and Edge (relationships) represent entities of the graph database. And since this capability is built into SQL Server 2017, already-existing databases don’t have to be ported to another system, so to speak.
Purpose
Today’s business and user requirements demand applications that interconnect more and more of the world’s data, yet still expect high levels of performance and data reliability. Graph representation offers a convenient means of handling complex relationships. This technique provides solutions to many important problems and helps derive the results within the scope of the given context.
From what it seems like, many applications of the future will benefit a lot, since they’d be built using graph databases.
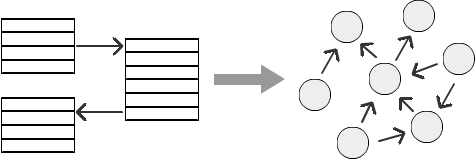
Data modeling – relational to graph
Demonstration
It’s demo time!
Let’s consider an example of an organization where an employee is mapped to Manager, Manager is mapped to Senior Manager, and so on. The hierarchy may go on and on, depending on the number of levels in the organization. As the number of levels increases, deriving a relationship in a relational database becomes a daunting task. Representing an employee hierarchy or marketing hierarchy or the social network connections are quite difficult using a relational database. Let’s see how SQL Graph can offer a solution when we drive down to the various levels of the hierarchy.
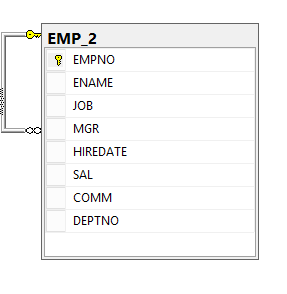
Let’s consider the simple employee data model for the entire illustration. In the emp table, the employee is identified with a unique identifier (empno), and the MGR column indicates an employee supervisor. The employee is a self-contained entity and can be queried using empno and MGR column

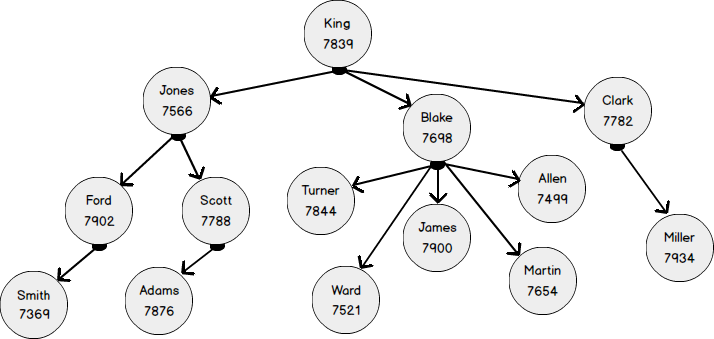
The following organization diagram depicts the most famous employee relationship model. It has four levels. The employee is a NODE of the employee table. The employee node is self-connected pointer with a ReportsTo relationship. In graph terms, the relationship is termed as the EDGE of the employee NODE
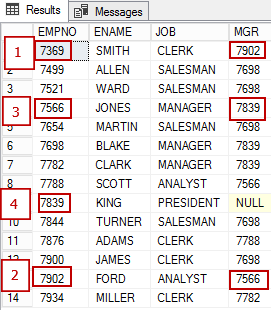
Let’s build a relational EMP table and insert the relational values as per the values of the organization chart
|
1 2 3 4 5 6 7 8 9 10 11 12 13 14 15 16 17 18 19 20 21 22 23 24 25 |
CREATE TABLE EMP (EMPNO INT NOT NULL, ENAME VARCHAR(20), JOB VARCHAR(10), MGR INT, JOINDATE DATETIME, SALARY DECIMAL(7, 2), COMMISIION DECIMAL(7, 2), DNO INT) INSERT INTO EMP VALUES (7369, 'SMITH', 'CLERK', 7902, '02-MAR-1970', 8000, NULL, 2), (7499, 'ALLEN', 'SALESMAN', 7698, '20-MAR-1971', 1600, 3000, 3), (7521, 'WARD', 'SALESMAN', 7698, '07-FEB-1983', 1250, 5000, 3), (7566, 'JONES', 'MANAGER', 7839, '02-JUN-1961', 2975, 50000, 2), (7654, 'MARTIN', 'SALESMAN', 7698, '28-FEB-1971', 1250, 14000, 3), (7698, 'BLAKE', 'MANAGER', 7839, '01-JAN-1988', 2850, 12000, 3), (7782, 'CLARK', 'MANAGER', 7839, '09-APR-1971', 2450, 13000, 1), (7788, 'SCOTT', 'ANALYST', 7566, '09-DEC-1982', 3000, 1200, 2), (7839, 'KING', 'PRESIDENT', NULL, '17-JUL-1971', 5000, 1456, 1), (7844, 'TURNER', 'SALESMAN', 7698, '08-AUG-1971', 1500, 0, 3), (7876, 'ADAMS', 'CLERK', 7788, '12-MAR-1973', 1100, 0, 2), (7900, 'JAMES', 'CLERK', 7698, '03-NOV-1971', 950, 0, 3), (7902, 'FORD', 'ANALYST', 7566, '04-MAR-1961', 3000, 0, 2), (7934, 'MILLER', 'CLERK', 7782, '21-JAN-1972', 1300, 0, 1) |
In the below show figure, the empno 7369, ReportsTo 7902, 7902 Reports To 7566, and 7566 ReportsTo 7839
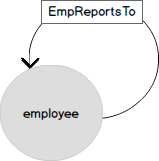
Now, let’s look at the Graph representation of the same data. The EMPLOYEE node has a several attributes. The employee node is connected to itself with a reportsTo relationship. ReportsTo is the name of the EDGE.
We can have attributes on the EDGE table as well
Create the node table, EmpNode
The syntax of creating a node is pretty straight forward: the create table syntax with AS NODE construct at the end of the table creation step
|
1 2 3 4 5 6 7 |
CREATE TABLE dbo.EmpNode( ID Int Identity(1,1), EMPNO NUMERIC(4) NOT NULL, ENAME VARCHAR(10), MGR NUMERIC(4), DNO INT ) AS NODE; |
Let’s now convert the relational table data into graph data. The following insert statement inserts the data from the emp relational table.
|
1 |
INSERT INTO EmpNode(EMPNO,ENAME,MGR,DNO) select empno,ename,MGR,dno from emp |
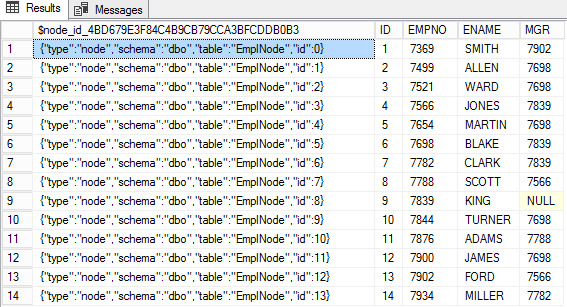
The Node table metadata field $node_id_* stores the nodeId values as JSON. The other columns of the NODE table are the attributes or the actual values of the node.
Create the EDGE
Creating an EDGE is similar to creating a node, except the use of keyword AS EDGE at the end of the edge creation.
CREATE TABLE empReportsTo(Deptno int) AS EDGE
Now, let’s define the relationship between the employees using EMPNO and MGR columns. The organization chart gives a good idea of defining the insert the statement
|
1 2 3 4 5 6 7 8 9 10 11 12 13 14 15 16 17 18 19 20 21 22 23 24 25 26 27 28 29 30 31 32 33 34 |
INSERT INTO empReportsTo VALUES ((SELECT $node_id FROM EmpNode WHERE ID = 1), (SELECT $node_id FROM EmpNode WHERE id = 13),20); INSERT INTO empReportsTo VALUES ((SELECT $node_id FROM EmpNode WHERE ID = 2), (SELECT $node_id FROM EmpNode WHERE id = 6),10); INSERT INTO empReportsTo VALUES ((SELECT $node_id FROM EmpNode WHERE ID = 3), (SELECT $node_id FROM EmpNode WHERE id = 6),10) INSERT INTO empReportsTo VALUES ((SELECT $node_id FROM EmpNode WHERE ID = 4), (SELECT $node_id FROM EmpNode WHERE id = 9),30); INSERT INTO empReportsTo VALUES ((SELECT $node_id FROM EmpNode WHERE ID = 5), (SELECT $node_id FROM EmpNode WHERE id = 6),30); INSERT INTO empReportsTo VALUES ((SELECT $node_id FROM EmpNode WHERE ID = 6), (SELECT $node_id FROM EmpNode WHERE id = 9),30); INSERT INTO empReportsTo VALUES ((SELECT $node_id FROM EmpNode WHERE ID = 7), (SELECT $node_id FROM EmpNode WHERE id = 9),30); INSERT INTO empReportsTo VALUES ((SELECT $node_id FROM EmpNode WHERE ID = 8), (SELECT $node_id FROM EmpNode WHERE id = 4),30); INSERT INTO empReportsTo VALUES ((SELECT $node_id FROM EmpNode WHERE ID = 9), (SELECT $node_id FROM EmpNode WHERE id = 9),30); INSERT INTO empReportsTo VALUES ((SELECT $node_id FROM EmpNode WHERE ID = 10), (SELECT $node_id FROM EmpNode WHERE id = 6),30); INSERT INTO empReportsTo VALUES ((SELECT $node_id FROM EmpNode WHERE ID = 11), (SELECT $node_id FROM EmpNode WHERE id = 8),30); INSERT INTO empReportsTo VALUES ((SELECT $node_id FROM EmpNode WHERE ID = 12), (SELECT $node_id FROM EmpNode WHERE id = 6),30); INSERT INTO empReportsTo VALUES ((SELECT $node_id FROM EmpNode WHERE ID = 13), (SELECT $node_id FROM EmpNode WHERE id = 4),30); INSERT INTO empReportsTo VALUES ((SELECT $node_id FROM EmpNode WHERE ID = 14), (SELECT $node_id FROM EmpNode WHERE id = 7),30);OR INSERT INTO empReportsTo SELECT e.$node_id, m.$node_id ,e.dno FROM dbo.EmpNode e inner JOIN dbo.EmpNode m ON e.empno = m.mgr; |
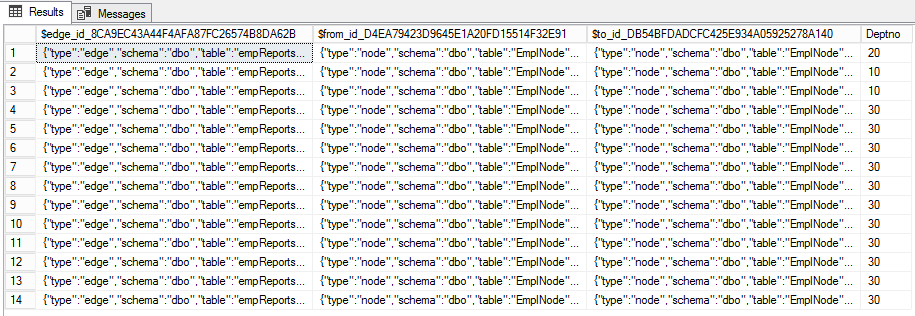
The Edge table, by default, has three columns. First, the $edge_id represents the identity of the edge in JSON. The other two columns $from_id and $to_id represents the relationship between the edges. Also, the edges may have additional properties as well. In this case its deptno.
System view
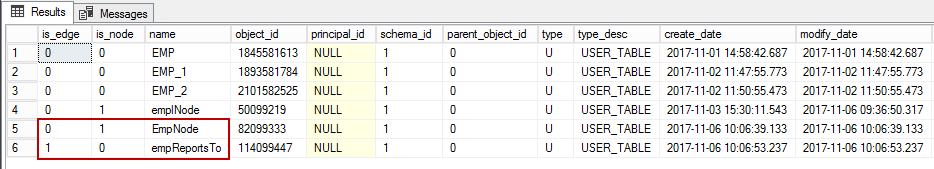
The system view, sys.tables, has two new columns:
- is_edge
- is_node
|
1 2 3 4 5 |
SELECT t.is_edge,t.is_node,* FROM sys.tables t WHERE name like 'emp%' |
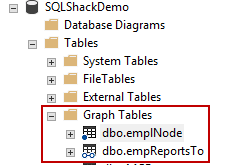
SSMS view
The objects of the Graph database are located in the graph tables folder of the SQLShackDemo database. The Node of the table is represented by dot, the edge is represented by open connectors (that look a little like a pair of glasses)
Match clause
The match clause is derived from CQL (Cypher query language). It’s an efficient way of querying graph properties. The CQL starts with the match clause. Using T-SQL the matching data nodes are traversed through the relationship.
The syntax
|
1 2 3 4 5 6 7 8 9 10 11 12 13 14 15 16 17 |
MATCH (<graph_search_pattern>) <graph_search_pattern>::= {<node_alias> { { <-( <edge_alias> )- } | { -( <edge_alias> )-> } <node_alias> } } [ { AND } { ( <graph_search_pattern> ) } ] [ ,...n ] <node_alias> ::= node_table_name | node_alias <edge_alias> ::= edge_table_name | edge_alias |
Examples
Let’s now look at some examples.
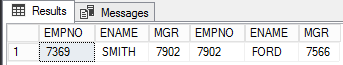
Here’s the query to display first-level employees who report to Smith, and Smith’s manager
|
1 2 3 4 5 6 7 |
SELECT E.EMPNO,E.ENAME,E.MGR,E1.EMPNO,E1.ENAME,E1.MGR FROM empnode e, empnode e1, empReportsTo m WHERE MATCH(e-(m)->e1) and e.ENAME='SMITH' |
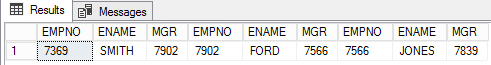
And here’s the query to display second-level employee and manager details for Smith. If we take out the where clause, the result will be displayed for all the employees
|
1 2 3 4 5 6 7 |
SELECT E.EMPNO,E.ENAME,E.MGR,E1.EMPNO,E1.ENAME,E1.MGR,E2.EMPNO,e2.ENAME,E2.MGR FROM empnode e, empnode e1, empReportsTo m ,empReportsTo m1, empnode e2 WHERE MATCH(e-(m)->e1-(m1)->e2) and e.ENAME='SMITH' |
And now, the query to display the third level employees and manager details
|
1 2 3 4 5 6 7 |
SELECT E.EMPNO,E.ENAME,E.MGR,E1.EMPNO,E1.ENAME,E1.MGR,E2.EMPNO,e2.ENAME,E2.MGR,E3.EMPNO,e3.ENAME,E3.MGR FROM empnode e, empnode e1, empReportsTo m ,empReportsTo m1, empnode e2, empReportsTo M2, empnode e3 WHERE MATCH(e-(m)->e1-(m1)->e2-(m2)->e3) and e.ENAME='SMITH' |

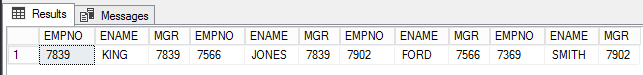
Now, let’s change the direction to fetch all the managers details for Smith
|
1 2 3 4 5 6 |
SELECT E.EMPNO,E.ENAME,E.MGR,E1.EMPNO,E1.ENAME,E1.MGR,E2.EMPNO,e2.ENAME,E2.MGR,E3.EMPNO,e3.ENAME,E3.MGR FROM empnode e, empnode e1, empReportsTo m ,empReportsTo m1, empnode e2, empReportsTo M2, empnode e3 WHERE MATCH(e<-(m)-e1<-(m1)-e2<-(m2)-e3) |
Wrapping up
SQL Server 2017 is proving to be a complete enterprise solution for various Business IT needs. The first version of SQL Graph very is promising, even though there are a quite some limitations, there is enough room to explore the graph features so far to be hopeful that Microsoft can deliver a fully-functional graph database within SQL Server.
The SQL Graph feature is fully integrated into the SQL Engine. As I mentioned, though, there are some limitations in this feature on SQL Server 2017, as of writing this article:
- No support for polymorphism
- SQL supports only unidirectional mapping
- Update on the edge columns is not allowed
- Transitive closure is not supported, but we can still achieve this using CTE
- Support for In-Memory OLTP objects is limited
- System table, Temporary table, and Global Temporary tables are not supported
- Table types and table variables are not declared as NODE or EDGE
- Cross-database queries are not supported
- There is no direct way or a wizard available to convert existing traditional database tables to graph
- There is no GUI, so we have to rely on Power BI to plot and view the graph
Stay tuned for more updates on this topic….
Table of contents

My specialty lies in designing & implementing High availability solutions and cross-platform DB Migration. The technologies currently working on are SQL Server, PowerShell, Oracle and MongoDB.
View all posts by Prashanth Jayaram
- Stairway to SQL essentials - April 7, 2021
- A quick overview of database audit in SQL - January 28, 2021
- How to set up Azure Data Sync between Azure SQL databases and on-premises SQL Server - January 20, 2021