
Introduction
This is my second article about Database Experimentation Assistant (DEA). Please refer to my previous article to see how to download and install DEA.
The Database Experimentation Assistant is the new A/B testing solution for SQL Server upgrades. It enables customers to gather performance insights for upgrades by customers to conduct experiments on production database workloads across two versions of SQL Server.
Analysis metrics reports provided by the tool, will give information about queries that have compatibility errors, queries performance and other workload comparison data so it can transmit to the customer a higher confidence for a successful migration project.
It supports migrating from SQL Server 2005 or higher versions to SQL Server 2012 and higher versions.
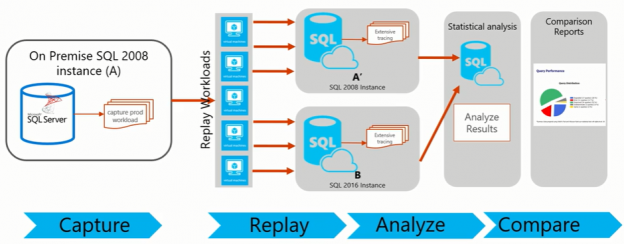
Below is an image representing DEA’s high-level architecture. Any of those tasks are DEA’s application options and each of them will be explained in this article.

NOTE: In the time I’m writing this article, DEA still in Technical-Preview release, meaning that things can slightly change in future releases but in general do not expect big changes from what is described in this article.
How to use
After DEA has been installed (please refer to my previous article to see how to download and install DEA.) you can click on the icon in the desktop area

This will start Database Experimentation Assistant by loading the following windows as startup screen:
The tool has three main features:
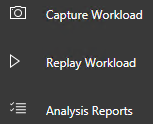
- Capture Workload: Ability to automatically capture a production workload trace with only a few inputs.
- Replay Workload: Ability to replay a trace on current and new/proposed instances of SQL.
- Analysis Reports: Ability to generate new reports which provide insight into how workload performance changes across versions of SQL. In addition to generating a new report, there is also the ability to view reports which have been previously generated.
Capture Workload
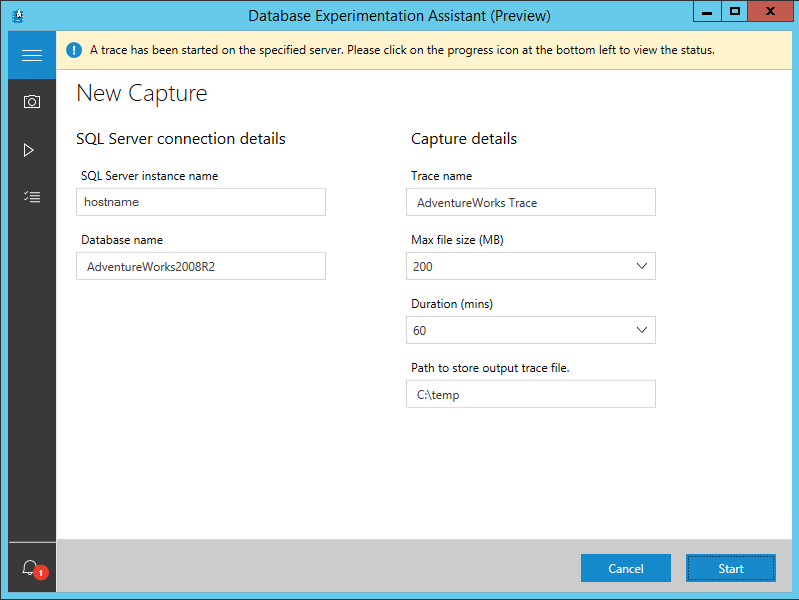
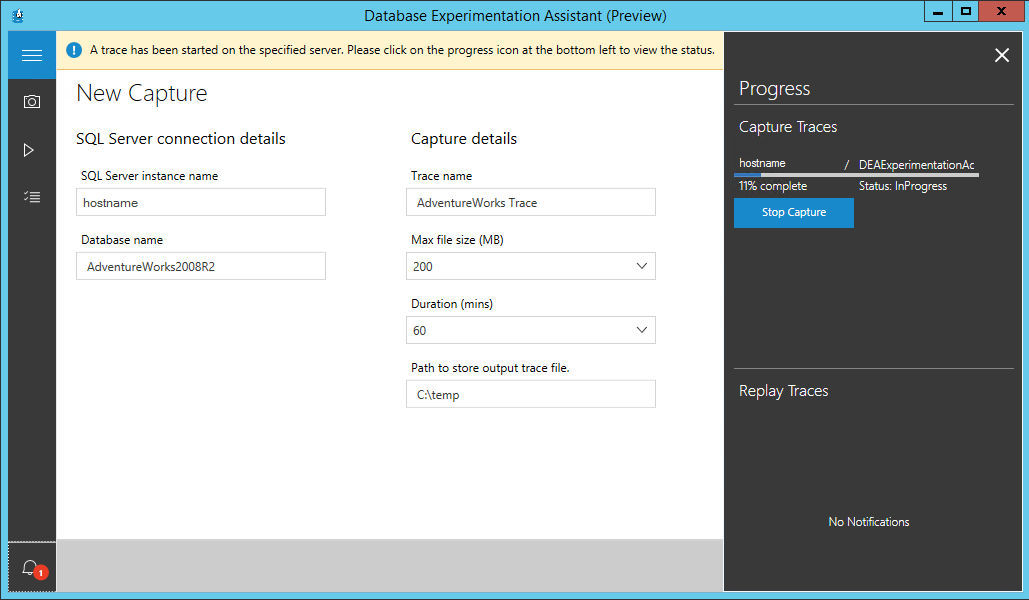
Use this option to capture a workload from the source SQL Server instance by producing a trace file (.trc) containing a log of the events occurred on the specified server within a given period of time. This action will ask for the input of some necessary information to produce the necessary trace file:

You will need to provide the connection details to the SQL Server instance name where you want to run the trace to capture the Database activities. If you do not specify a database name the trace will capture the activities on all the databases on the SQL Server instance.
Note: Be sure that the user that is running the Capture has the necessary permissions to start a trace in the desired SQL Server instance. Also, confirm if there is any firewall protecting the related SQL Server, there are rules to permit the current machine to access the source SQL Server instance.
Give the Trace a name and specify the destination path for the trace file. Configure the max file size for rollover and duration of the trace in minutes. Default values are 200MB and 60 minutes, respectively.
Note: The file path to trace file must be on the source SQL Server machine the MSSQL instance is on. Write permissions to the specified folder from the SQL Service account it is needed in order for the trace file to be written.
Click on the Start button to initiate the new trace file capture. If there are invalid inputs they will be highlighted and you are able to provide the correct information and after that click again on the Start button to begin the capture trace process. You will be able to see a message stating that the trace has been started and running.
While waiting for the end of the capture trace process, you can monitor the progress of the capture by clicking on the bell icon at the bottom left of the navigation pane.
After successfully finished the Capture process, copy the generated trace file or files to the machine where you have the Distributed Replay Controller. You will need it for the next step.
Replay Workload
Replay trace allows you to replay the previously created trace file (.trc) on another SQL Server instance.
This action needs to be performed twice. Once for the source SQL Server instance (A) and once for the Target upgraded SQL Server instance (B).
Check the call for attention on this screen. It says that a backup of the database or databases from the source SQL Server instance needs to be restored in the target SQL Server instance. The necessary databases are the ones included in the trace captured in the previous step.
It also says that to perform this action you must manually set up machines to run distributed replay (D-Replay) traces. Read my article about how to set up a SQL Server Distributed Replay to know how to use it.
Assuming that the backup of the necessary databases have been restored and the Distribution Replay environment is set then is time to initiate a new replay.
In the Verify Setup tab, provide the SQL Server install path (actually is the root path for the Tools) and end it with the backslash (‘\’). Example for MSSQL 2014 default installation path: C:\Program Files (x86)\Microsoft SQL Server\120\
Provide the D-Replay Controller machine name and the respective Clients that you want to use by separating them with a comma (‘,’):
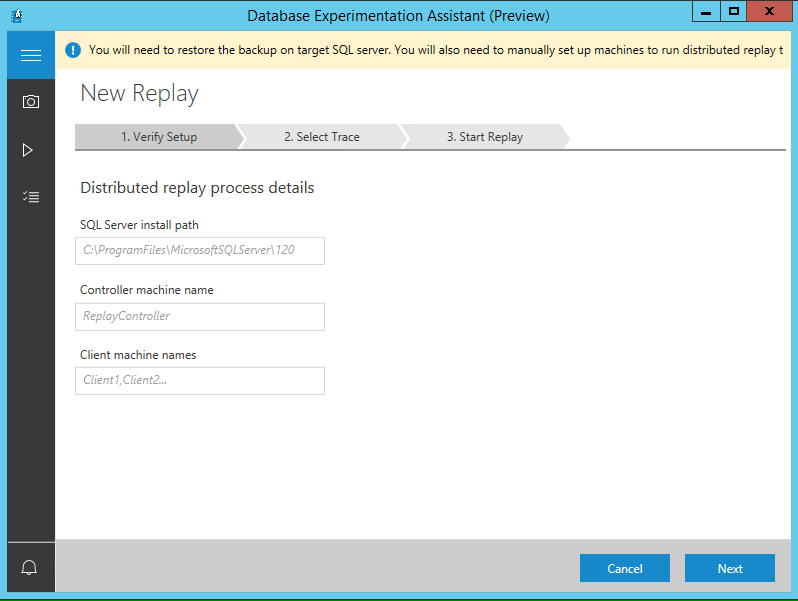
Press Next to continue.
On the second tab (Select Trace) provide the path for the trace captured before (you must include the trace file name in the path) and provide also the path where you want the intermediate file to be created by the preprocess task of the Distributed Replay.
NOTE: Those paths must exist in the SQL Server Distributed Replay Controller machine.
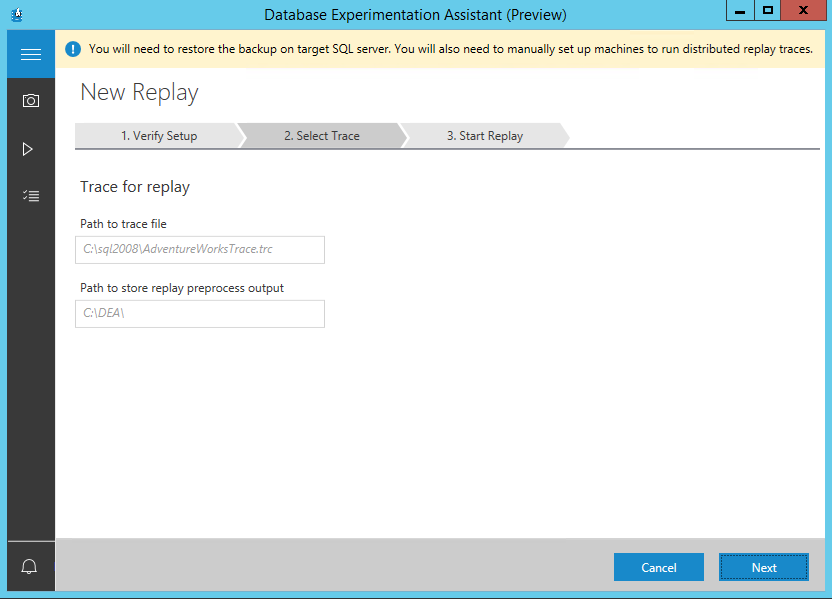
Press Next to continue.
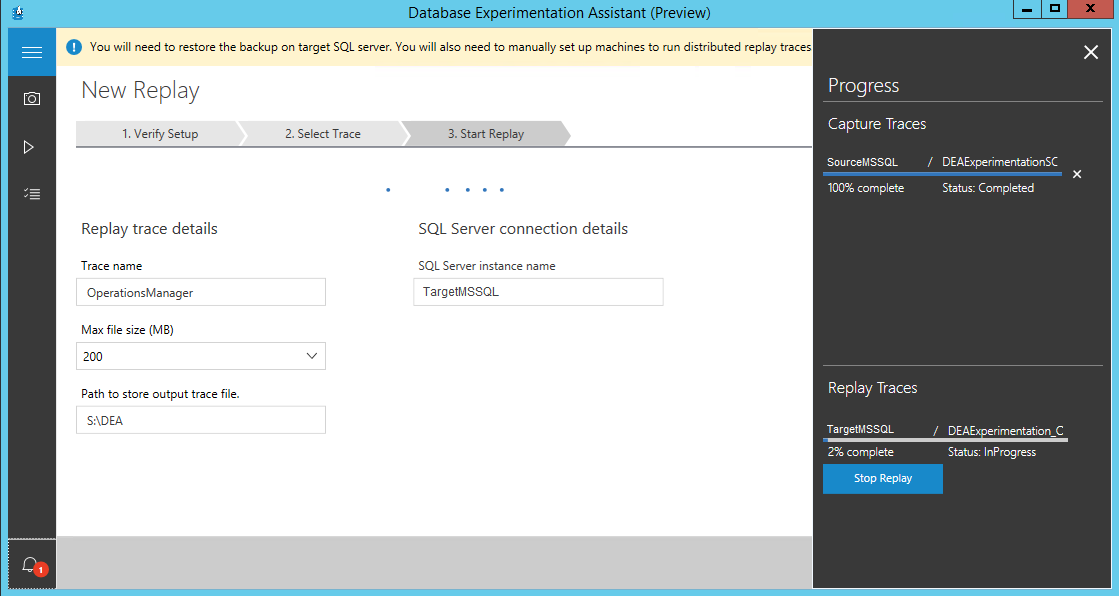
In the third and last tab (Start Replay), provide the Trace name, Max file size and the target SQL Server instance as well the path to store the output trace files (should be a folder that exists in a SQL Server instance and a SQL Server service account needs to write permissions on it)
NOTE: At the first interaction you should provide the source SQL Server instance and then on the second interaction provide the target SQL Server instance name.
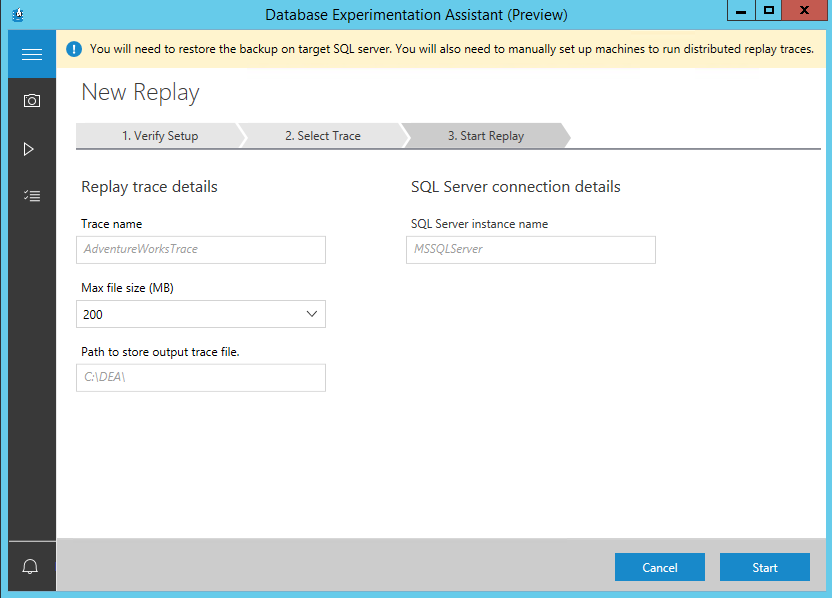
If the inputs are valid, click on the Start button so Replay process will start.
While waiting for the end of the Replay task to finish, you can monitor the progress of the task by clicking on the bell icon at the bottom left of the navigation pane.
After the Replay finishes running for the source SQL Server instance (A), repeat the steps for this task now providing the necessary information for the target SQL Server instance (B).
Analysis Reports
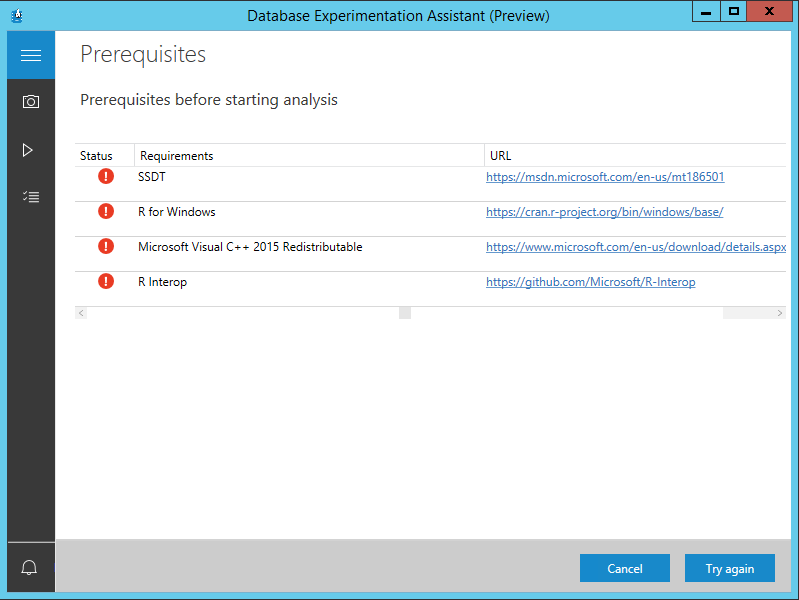
This option needs some components as prerequisites so when choosing this option, if you see a similar screen to the below, please refer to my previous article to see how to download and install DEA and read the respective Requested components section.
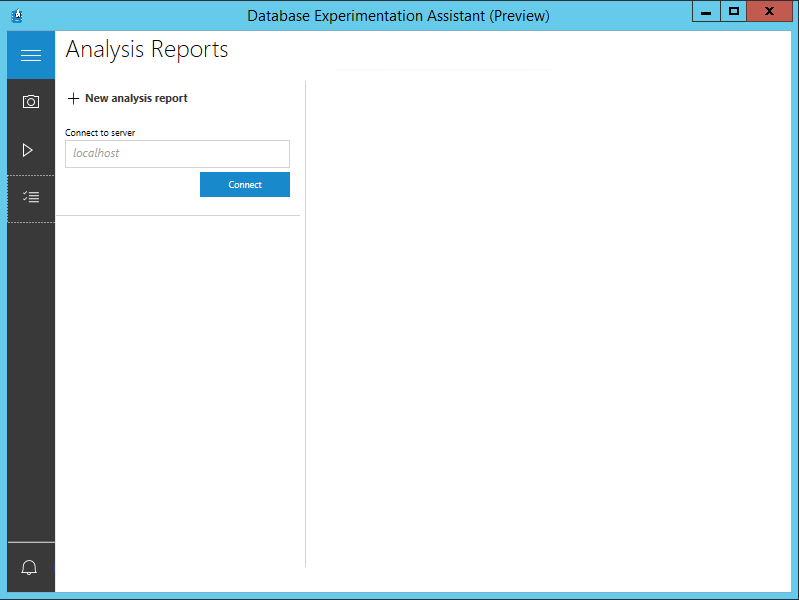
If or when you have all the requested components then you should see a similar screen as below.
Click on the + New analysis report to create a new report or to access to a previously created report, provide the SQL Server instance name in the Connect to server field a click on the Connect button. This will load the available analysis reports stored in the given SQL Server instance so you can choose which one you want to review.
By clicking on + New analysis report it will present the below screen and you need to fill the fields by providing a name for the Report and providing the SQL Server instance name where the Analysis databases will be created.
Also, provide the location and the file name for the Trace for source server (the first trace file name originated from the Replay task on the Source server) as well location and the file name for the Trace for target server (the first trace file name originated from the Replay task on the Target server).
Note: If those trace files are not stored on the local machine you will need to provide the full network path as \\servername\sharename$\tracefilename.trc.
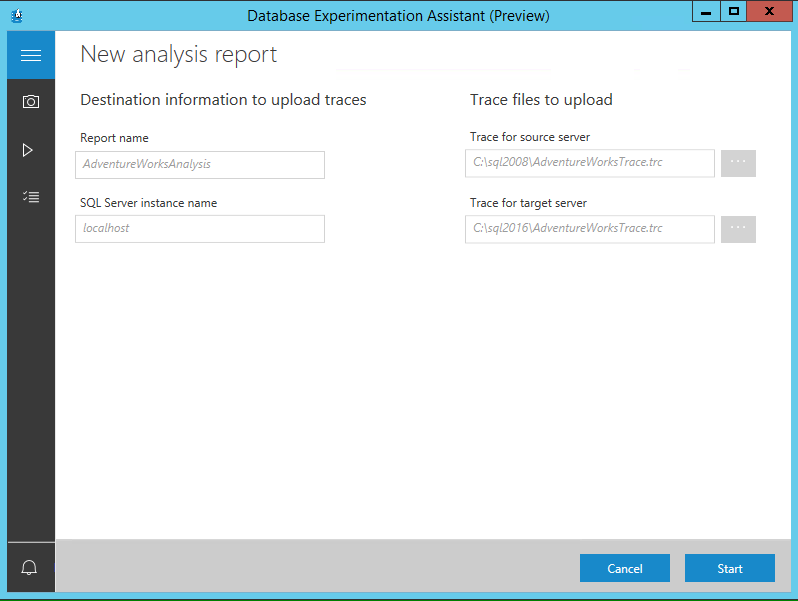
Click the Start button to generate the Reports.
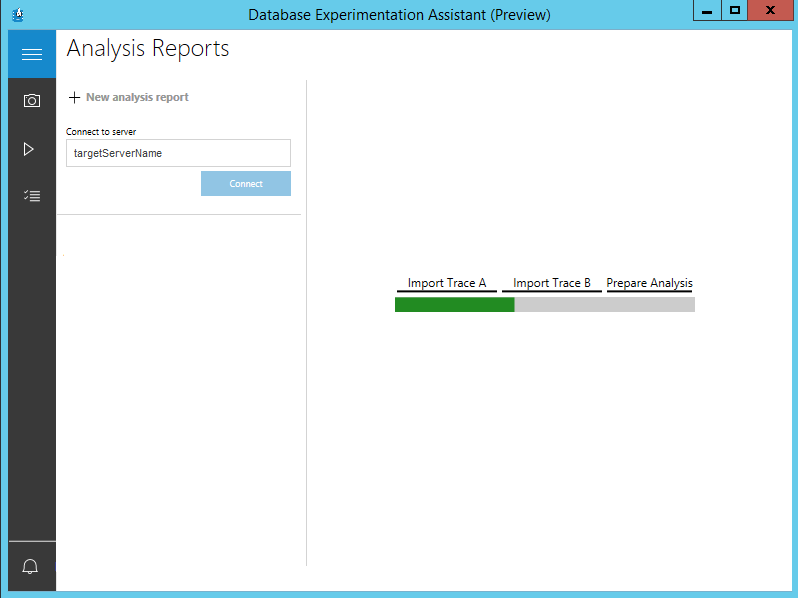
You can follow the progress on the right pane where you will see three phases:
- Import Trace A – Loads the trace originated from the Replay task on the Source server. In the SQL Server instance provided for the Analysis option, you will see the creation of a database called A<Report name><unique identifier>.
- Import Trace B – Loads the trace originated from the Replay task on the Target server. In the SQL Server instance provided for the Analysis option, you will see the creation of a database called B< Report name><unique identifier>.
- Prepare Analysis – Analysis the result of the previous two imports. In the SQL Server instance provided for the Analysis option, you will see the creation of a database called Analysis< Report name><unique identifier>.
Compare
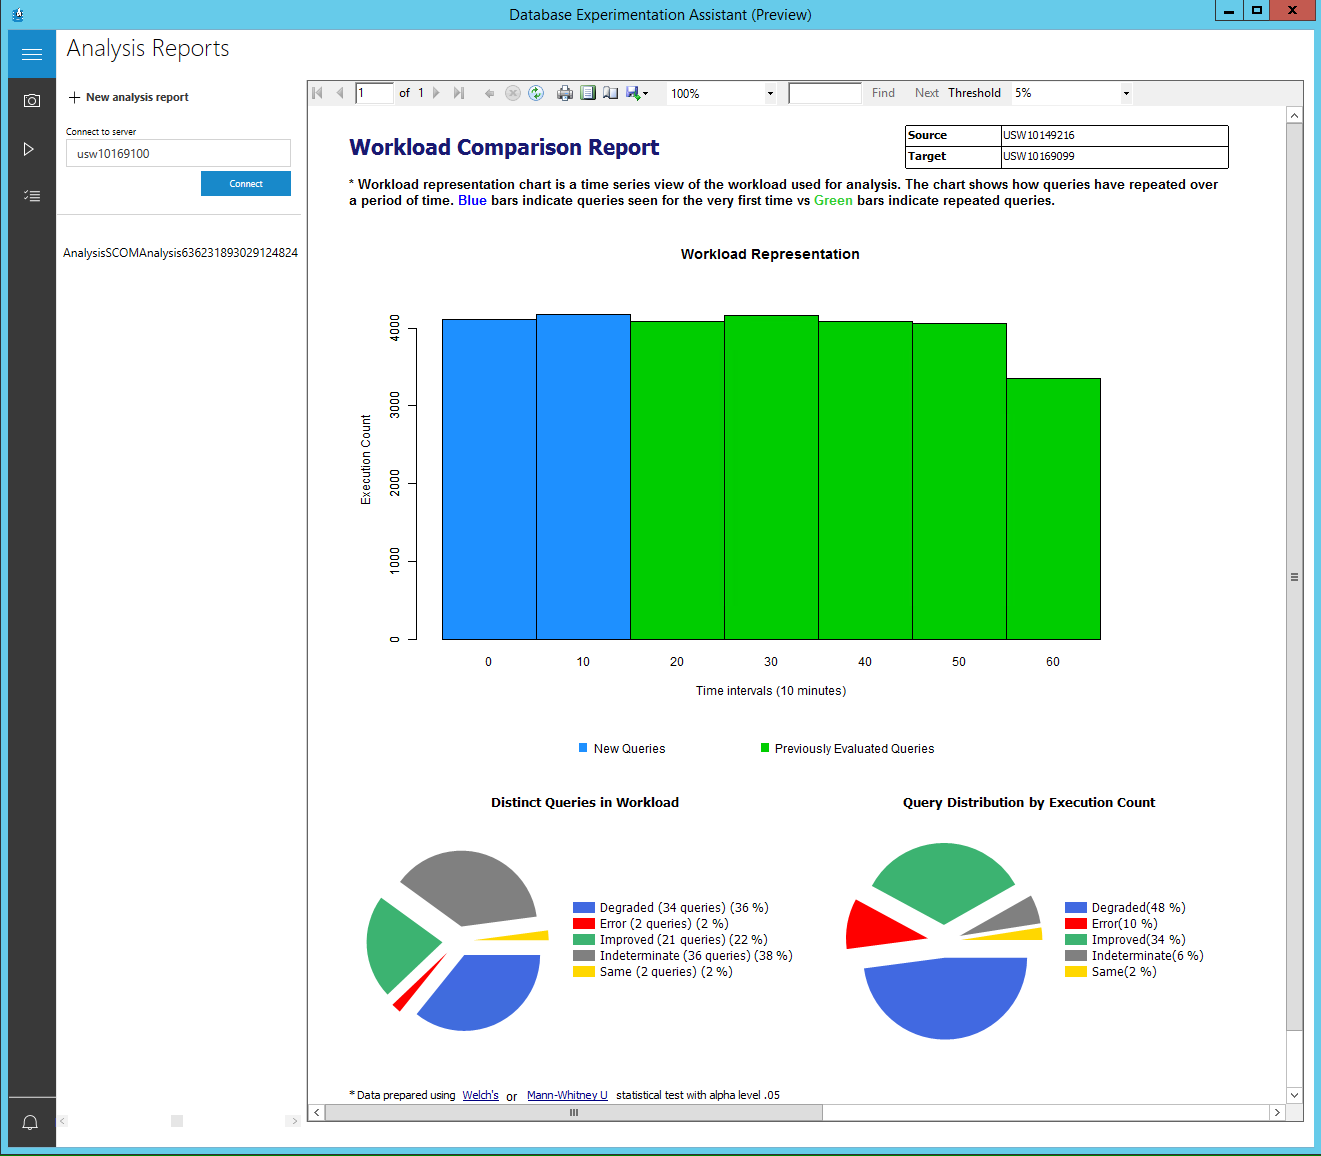
When all the above phases finish successfully it will present the Analysis Report where you can compare the queries execution against the Source and Target SQL Server instances.
The Analysis Report let you drill down into each item to identify the problematic queries so they can be fixed. In my example, if I click in Error (red slice) I will get the following report:
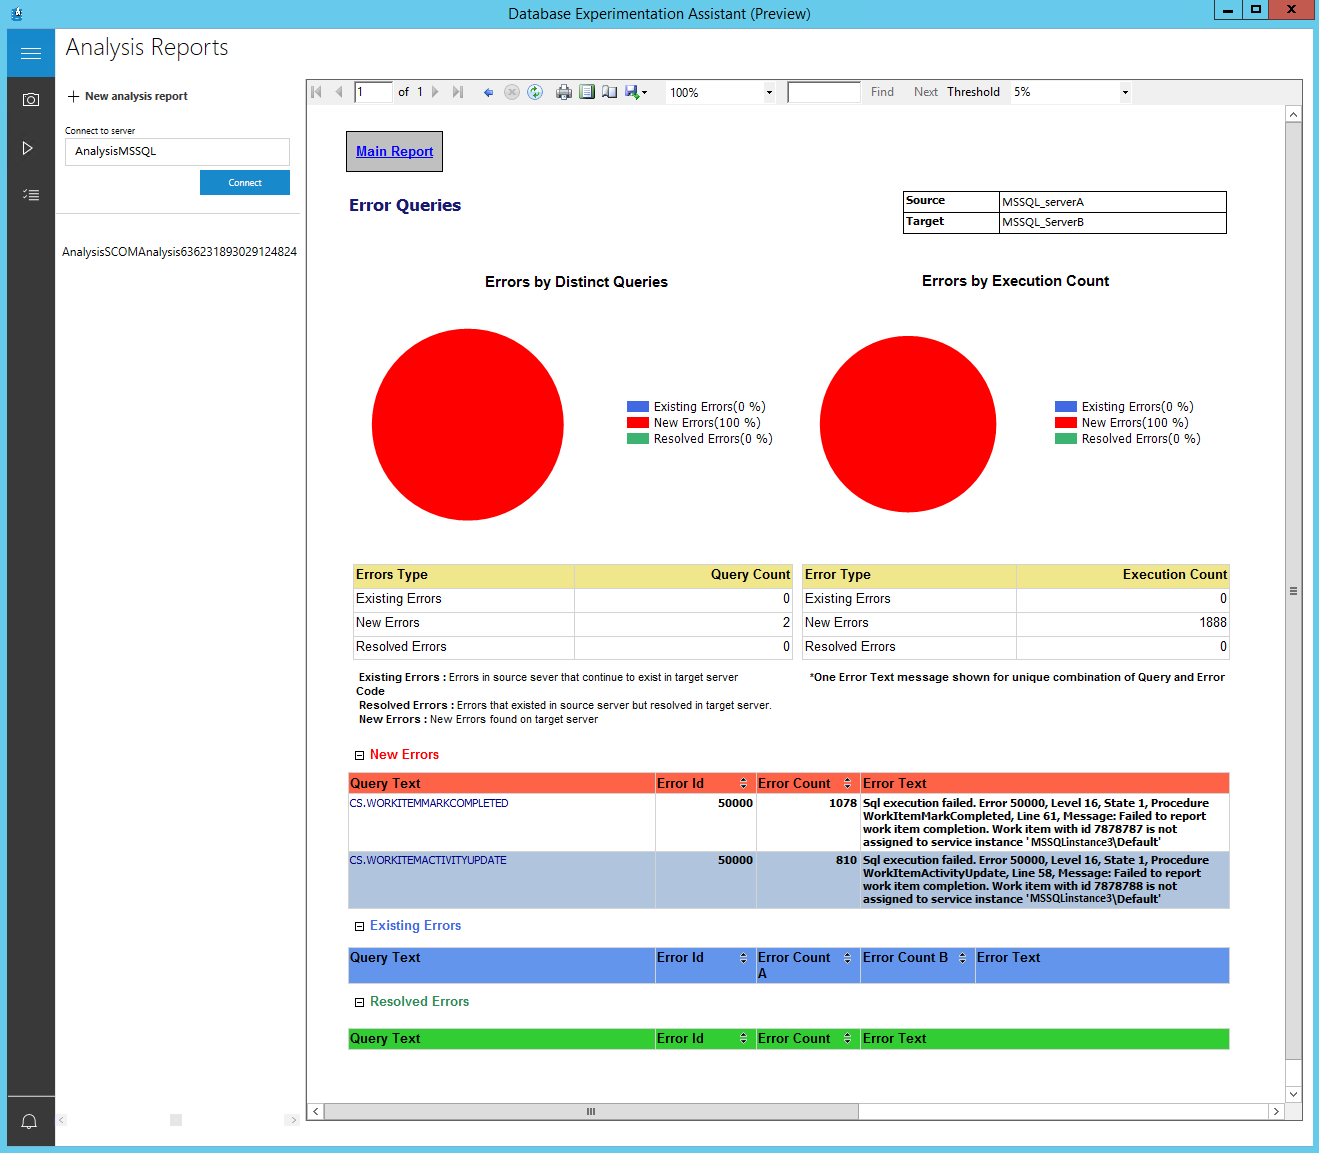
In the query table, it is possible to see which queries returned errors and the respective error messages. In my case, the errors occurred because my target SQL Server instance does not have access to the referred SQL Server instance (MSSQLinstance3\Default).
Clicking in the Main Report button it will return to the main Analysis Report and we can click on other items. For example for Degraded queries (blue slice) where it will present a table with the queries and how much it took for running in Source and Target server and how much is the difference between them:
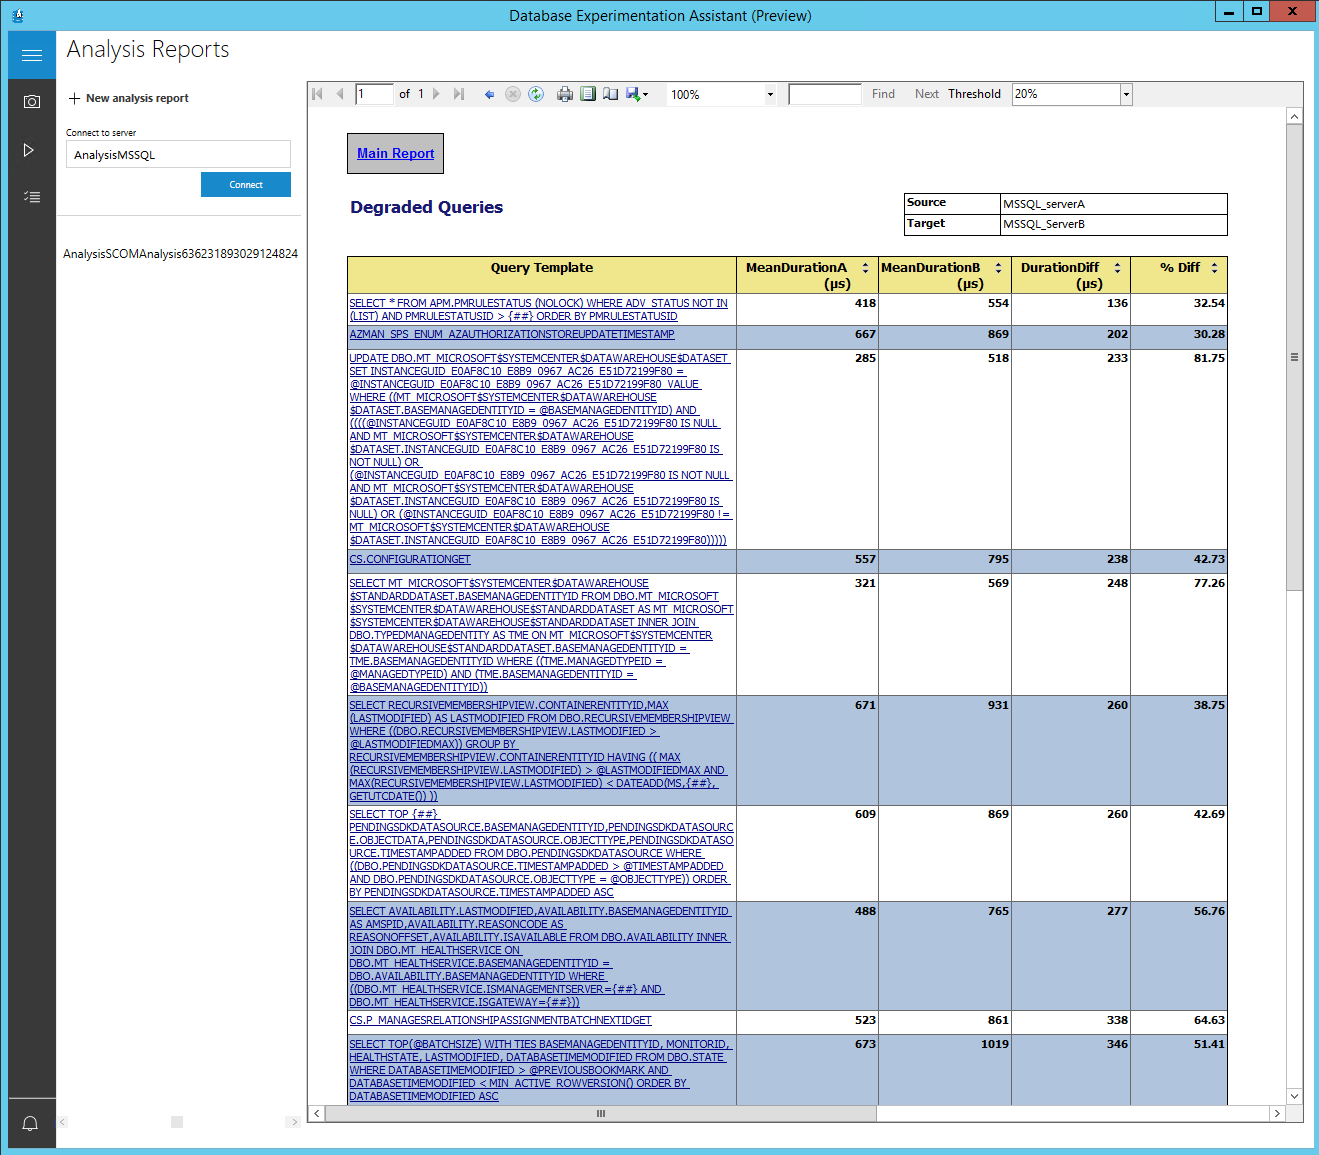
You can drill down even more by clicking in the query and you will have access to more information including the query plan for each server so you can look for issues and try to find a solution to solve them.
This is how you should evaluate the issues and accept them “as is” or try to solve them. You can return and run the Analysis Report as many times you want and need until all the issues are solved. IN this way DEA is a tool to attest a migration and provide information on expected issues so you can have time to solve those issues before advancing in definitive with the migration.
Other articles in this series:
- How to download and install the SQL Server Database Experimentation Assistant (DEA)
- How to download and install the SQL Server Database Experimentation Assistant (DEA v2.0)
References:
- Technical preview: Database Experimentation Assistant
- Database Experimentation Assistant – FAQ
- How to use DEA tool

He participates in some SQL Server forums, helping other professionals solving SQL Server issues and acting as their mentor whenever is possible.
Vitor also has a website with some useful information about SQL Server: https://f1-sqlserver.wixsite.com/f1-sqlserver
View all posts by Vitor Montalvão
- An introduction to sp_MSforeachtable; run commands iteratively through all tables in a database - August 18, 2017
- SQL Server system databases – the model database - August 9, 2017
- SQL Server system databases – the msdb database - July 14, 2017