
Introduction
In this new article, we will create a SQL Server Report using SQL Server Reporting Services from a SQL Server machine installed in an Azure Virtual Machine. We will show step by step how to connect from a local machine to a VM Azure Database and generate a SQL report.
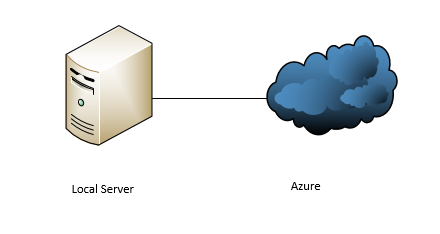
Requirements
- For the article, it is required the VM in Azure installed.
- It will also be necessary the Azure subscription.
- You will also need a Virtual Machine in Azure with the SQL database installed on it (you can review our article about VM machines). We just need the Database installed.
- A Server with the Windows OS installed locally.
- The SQL Server Data Tools for business intelligence installed in the local machine to generate the SQL Server Reports.
- The SQL Server installed in the local machine (specially the SSRS).
- The Adventureworks database installed on the VM Azure machine or any other database with tables and data already created. In this article, we will use the Adventureworks2014 database.
- It will be necessary a SQL Endpoint on the portal.
- The SQL Port needs to be enabled, and also the EndPoint rules should be enabled. You can check our article we will explain how to do it step by step.
- The SQL Server authentication enabled in Azure.
- A SQL Account and a SQL password in Azure.
Getting started
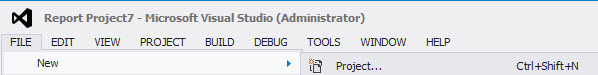
Open the SSDT for Business Intelligence or the Visual Studio and in the menu, go to File> New Project.

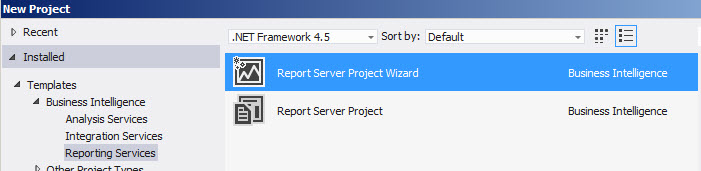
Figure 1. The SSRS menu Select the Report Server Project Wizard.
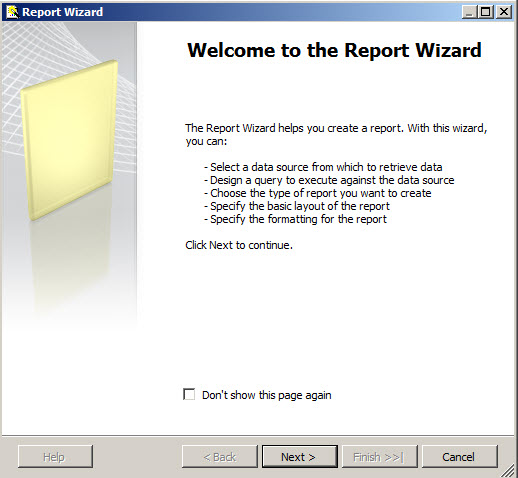
Figure 2. The reporting service Wizard The Welcome to the Report Wizard message will be displayed. Press next.
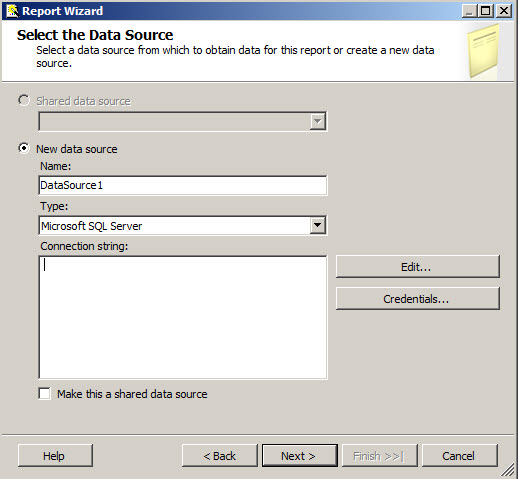
Figure 3. The Welcome wizard To connect to the Azure Database, press the Edit button.
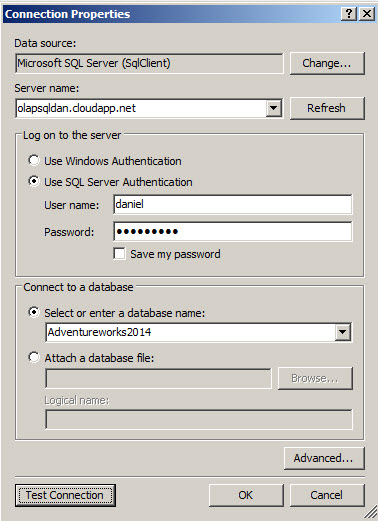
Figure 4. The Data Source connection information The server name is the name of the Azure VM. In this example, the name of the VM is olapsqldan.cloudapp.net. This name can be found in the Azure Portal. You will need to specify the SQL Server account created on the VM machine (in the requirements). Finally, we will specify the Database name. In this example, the database name is the Adventureworks2014. You can use other database from your preference.
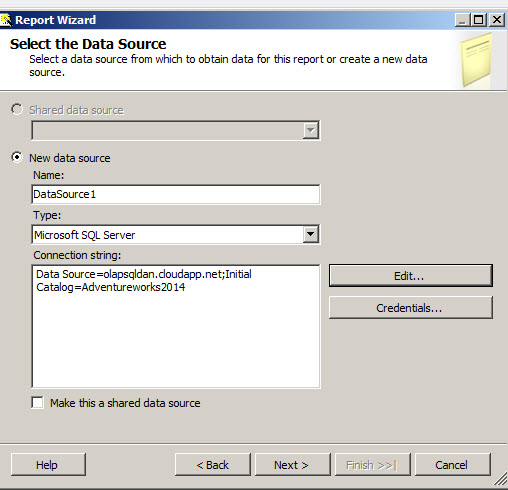
Figure 5. The connection information to Azure Once the connection information is specified, press next.
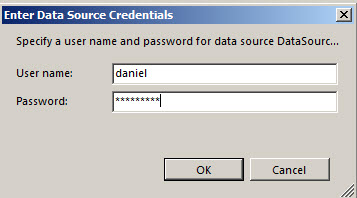
Figure 6. The credentials to Azure You will be asked the SQL Server credential again. Once entered, press OK.
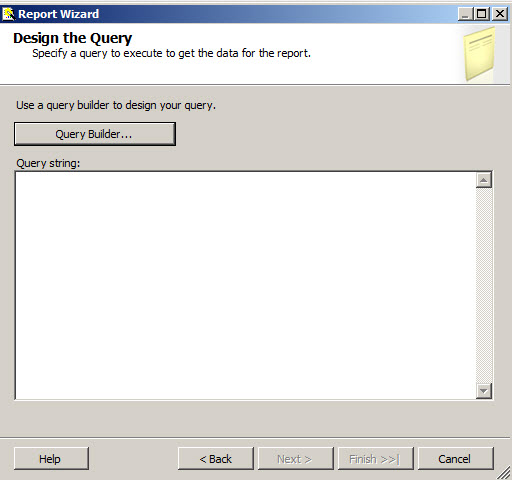
Figure 7. The Data Source Credentials The design the query window is used to write the query. You can write the query manually, copy and paste from other tools like the SQL Server Management Studio (SSMS) or use the Query Builder to create the query with friendly UI tools. We will press the Query Builder button in this example.
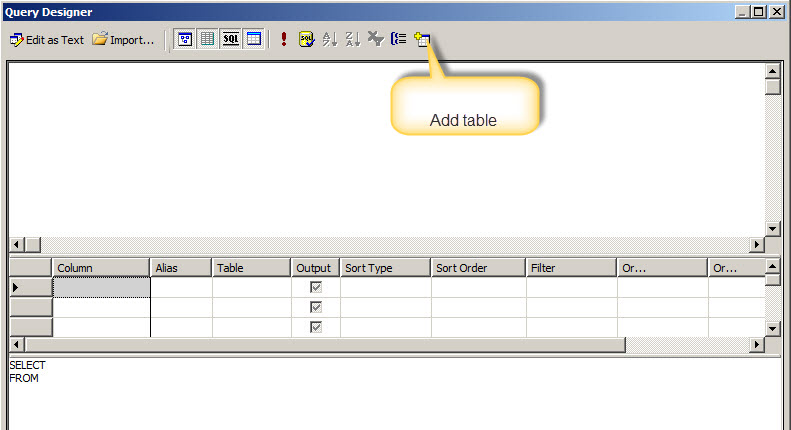
Figure 8. The Query Builder In the query designer, press the option to add a table.
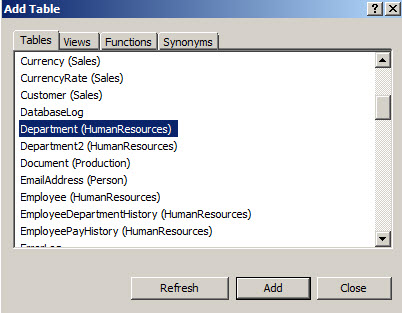
Figure 9. Adding a table in the Query designer Select the Department table (or any table of your preference) and press the Add button.
Figure 10. Selecting tables Select the columns that you want to be displayed in the report.
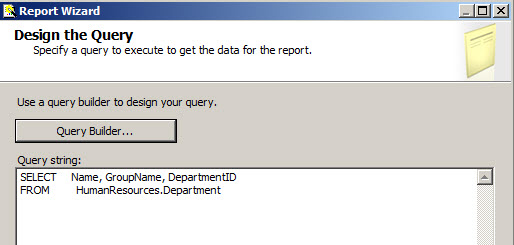
Figure 11. Selecting columns If you have T-SQL knowledge, you could modify manually the queries done in steps 10 and 11. If not, just go to the next window.
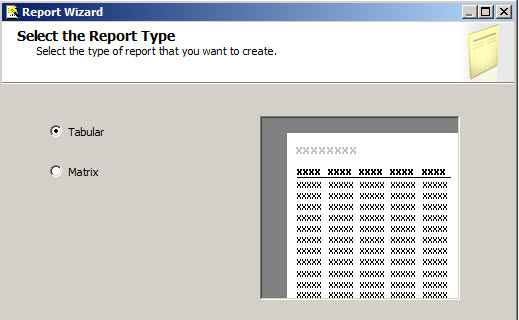
Figure 12. The query string There are 2 options for the report type:
- Tabular, which will show the information in columns. This option has a fixed number of columns.
Matrix, which will combine the information of rows and columns using dimensions. The number of columns depends on the results of the query.
In this example, we will use the Tabular option.
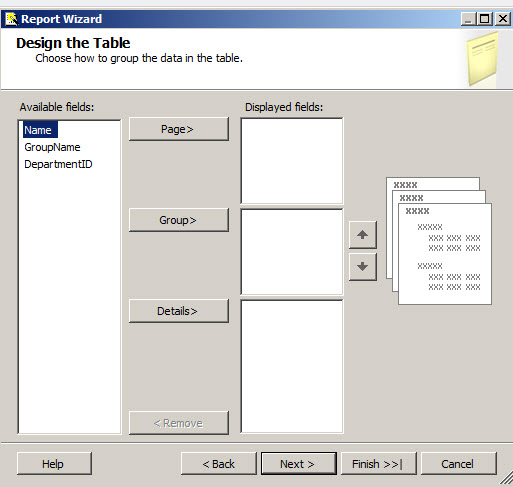
Figure 13. The report type You can separate or classify the reports in groups pages based on available fields. The next window will give us option to group the data and show which fields will be displayed. For example, we can create groups per groupname. In this example, we will use the default values and press next.
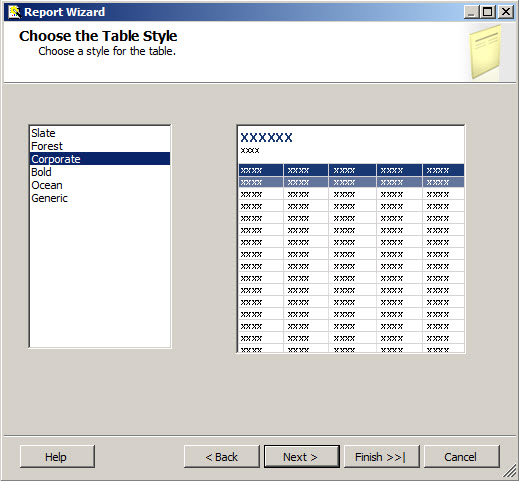
Figure 14. The option to group data in reports There are some few default styles in the report wizard. Slate, Forest, Corporate, Bold, Ocean and Generic. If you do not like any of these default reports, you can customize the reports later. In this example, we will use the Corporate style, but you can choose any other option. Once the style is chosen, press Next.
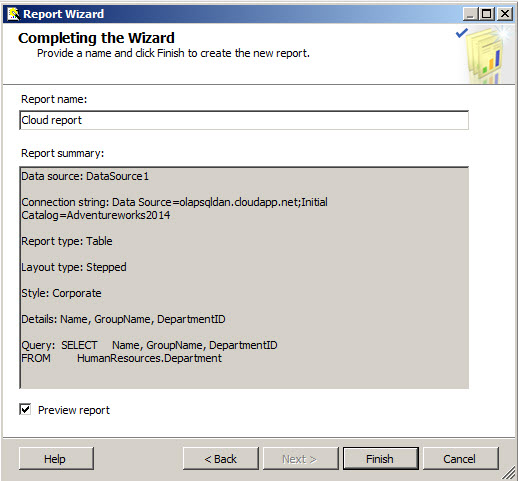
Figure 15. The different table styles The Completing the wizard will display all the option chosen. You can review and verify that the Datasource, connection string, report type, layout type, style, details and the query are OK. Additionally, you can check the Preview report option to see a Preview of the report directly. In this example, we are going to enable this option. Once selected, press Finish.
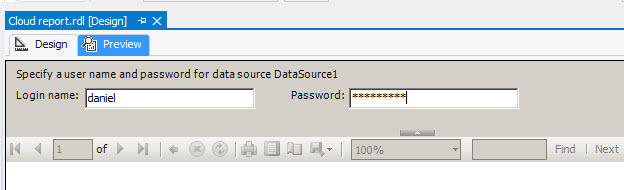
Figure 16. The last option of the wizard In this example, we are using the SQL Authentication to connect to the VM Azure Database. The report will ask the credentials of the step 5. Once the SQL login and the password is specified, execute the report.
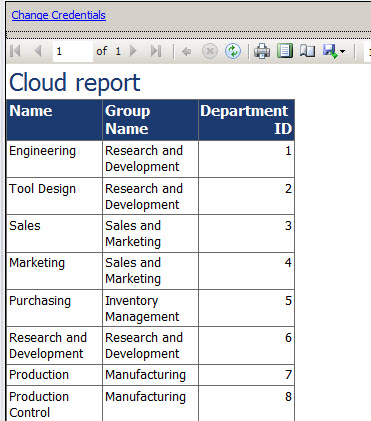
Figure 17. The login and password requests Once finished, you will have your report ready. You can edit, export to pdf, word, Excel or other formats of your preference.


Conclusion
As you can see, once you can connect to the VM in Azure the process to create local reports is very simple. You can work as a local database. The Internet speed will make the difference. If you need to work with large reports and your Internet connection is not fast enough, it can be a problem. However, besides the internet speed, you do not have restrictions. You can create charts, maps, KPIs or any other feature of your preference.
Once you have the connection to the Azure VM, the process to create reports is the same as a simple local report.

He has worked for the government, oil companies, web sites, magazines and universities around the world. Daniel also regularly speaks at SQL Servers conferences and blogs. He writes SQL Server training materials for certification exams.
He also helps with translating SQLShack articles to Spanish
View all posts by Daniel Calbimonte
- PostgreSQL tutorial to create a user - November 12, 2023
- PostgreSQL Tutorial for beginners - April 6, 2023
- PSQL stored procedures overview and examples - February 14, 2023