As we progress in our career as a SQL Server Database Administrators we encounter situations where managing and monitoring a large number of SQL Servers is the daily job requirement. Monitoring SQL Server is a very vast and detailed area of study. Out of all the monitoring the very basis and critical monitoring in the Resource Utilization Monitoring for SQL Server.
Keeping an eye on the SQL Server Resources might not look like a big task but it becomes near to impossible if you have 100s of instances and you need a historical analysis of the resources while not spending huge amount of money on third party tools. Also, wherever we have high volume of instances and computers to monitor we always want to have a Dashboard to have a summarized holistic view of the servers being monitored. All of the above requirements are really simple yet critical and are easily fulfilled by the SQL Server rarely used feature known as “SQL Server Utility”.
In this article I will let you know the benefits, usage and the way to install the Utility Control Point for multiple instances. This article does not cover each and every detail of the said feature but lists out most important features and critically important that “how to install” the Utility Control Point and configure multiple instances for monitoring.
Importance and Utility
SQL Server Utility Control Point is a feature which is easily configurable and will give you the ability to view the historical information about the SQL Server Storage Information Categorized by the Logical Drives as well as by the Databases, SQL Server CPU Instance Utilization and the Computer/Machine level CPU utilization. The detailed information becomes critically important when you can view the historical records by day/week or month. The summary is useful when you want to review all the instances at a glance and wants to have a quick view about any alerts for any instances at CPU/Storage level.
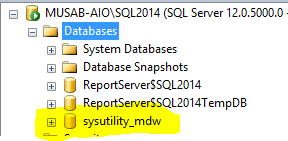
SQL Server Utility Control Point needs to be installed on an Instance first which will host the UCP Repository Database containing all the historical data about the enrolled instances. The database is named as “sysutility_mdw”. If you want to have a description of the name of the said database, it will be like “System Utility Management Data Warehouse”.
The SQL Server Utility Control Point is a single instance data warehouse where all enrolled instance related data will be available and the dashboard will display data from this UCP. Also, the installation of the UCP will create multiple jobs on the UCP Instance which will collect Resource Utilization data after a specified interval (normally 15 minutes). When you have installed a single UCP now you are ready for enrolling the Instances which you need to monitor and you can add all the instances one by one and it will start storing data for all those instances and will display the information after 15 minutes of enrollment.
So, after the summary let us get started about the detailed installation guide about how to Install SQL Server Utility Control Point and enrolling SQL Server Managed Instances.
Step by Step guide for Utility Control Point Installation
-
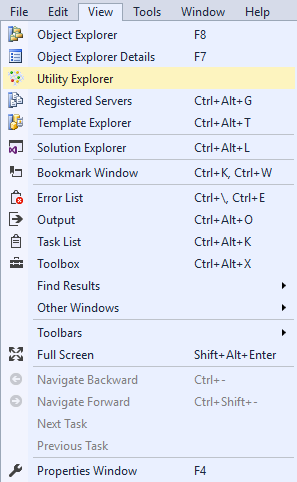
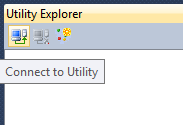
To start eh installation, in the SQL Server Management Studio “View” menu you will see the option for “Utility Explorer”, click it and it will open up the splash screen.
-
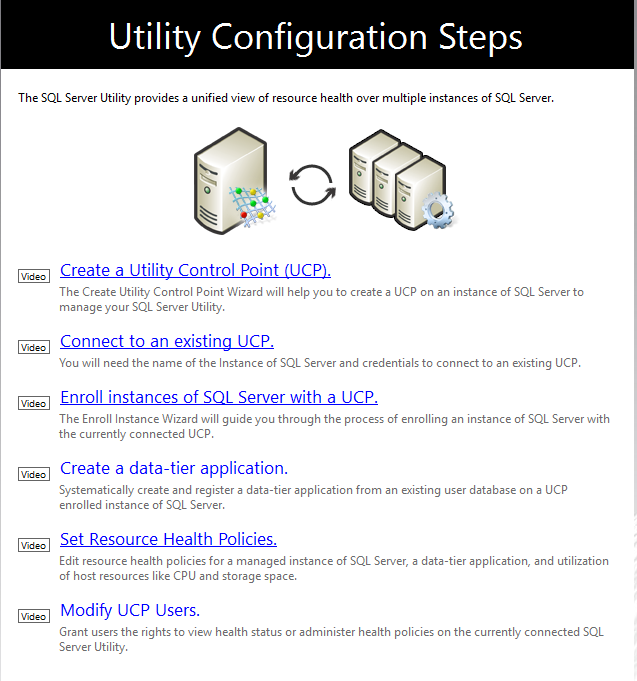
Click on “Create a Utility Control Point”, it will open up the Wizard for installing the UCP and the MDWD (Management Data Warehouse).
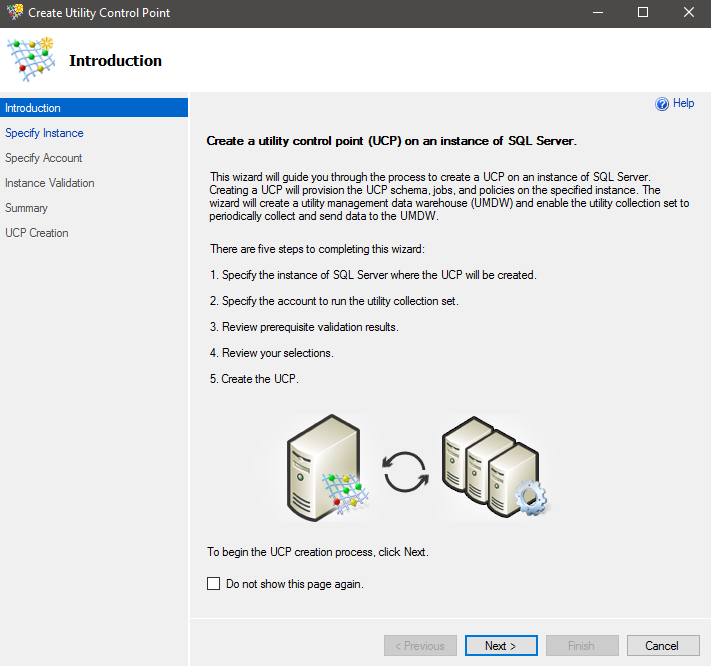
-
Click Next, and it will open up the next window in which you can connect to the instance on which you need to install the UCP and mention a name for your Utility Control Point like “ProdUCP” or whatever naming convention you feel it would be suitable for your organization. And click “Next”.
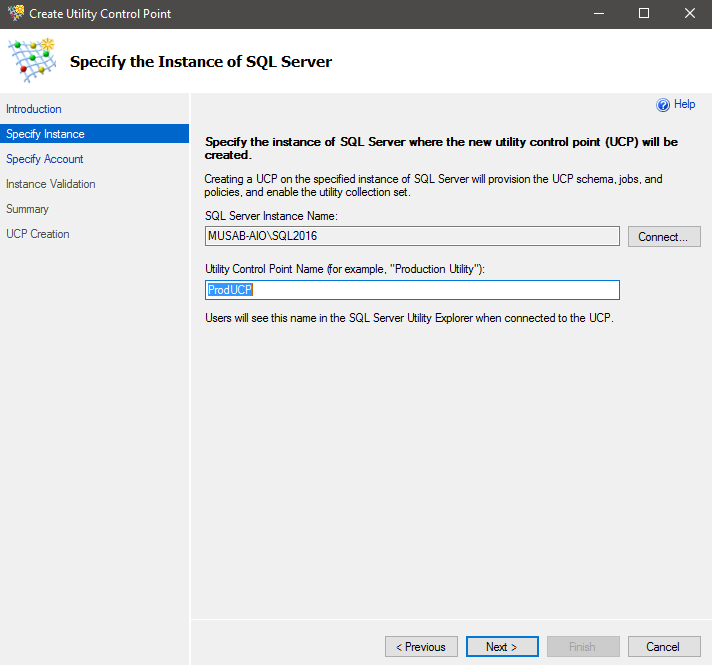
-
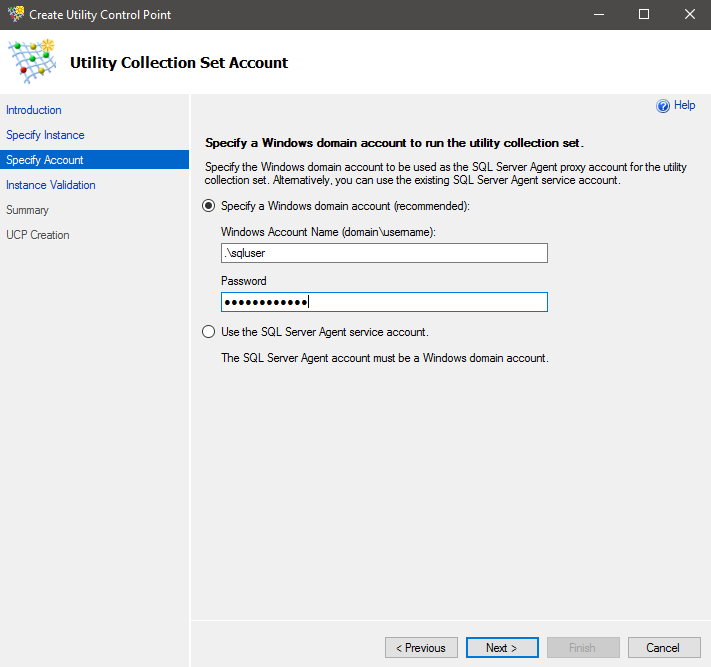
In this windows, you can enter a domain account which will be used to run the collection set. This account is usually the account which is running the SQL Server Agent. You can either mentioned a valid domain account or use the SQL Server Agent Account. Enter the details and click “Next”.
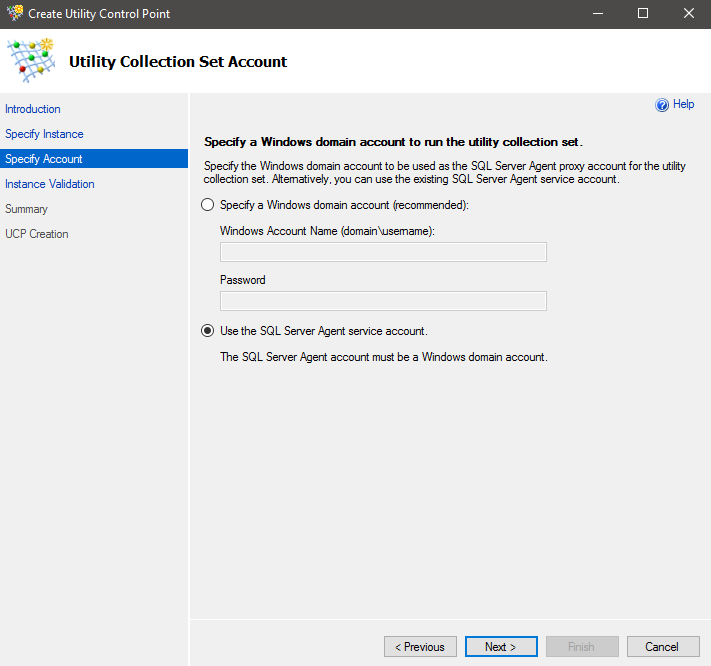
-
The wizard will run a validation which must pass. The most common errors are described below with solutions:
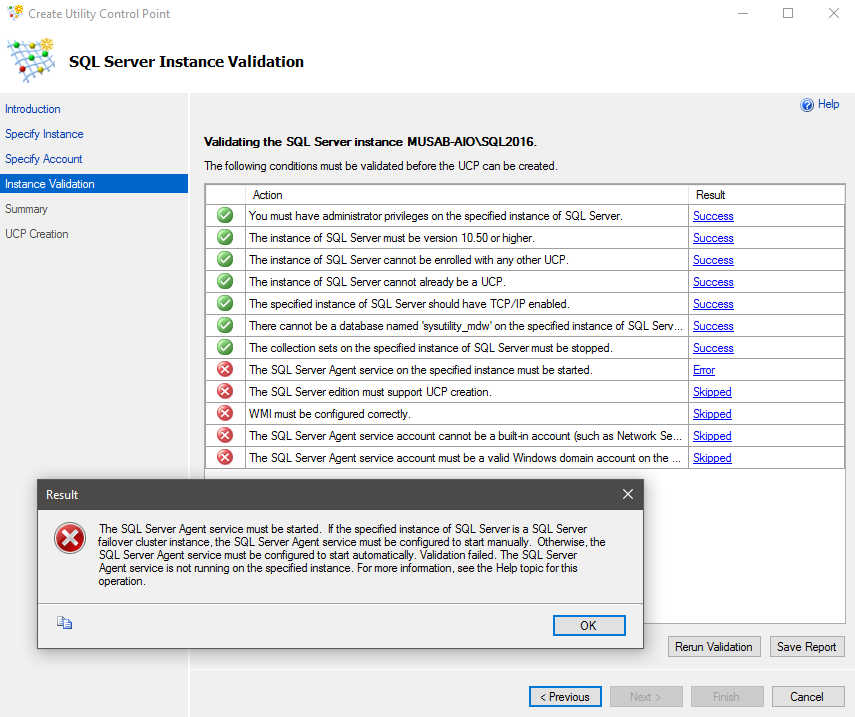
The above mentioned error will be thrown if you have SQL Server Agent disabled. The SQL Server Agent must be enabled and in Automatic State to pass the validation. So enable it and make it automatic. In case of the Clustered Instance the manual state will be passed as well.
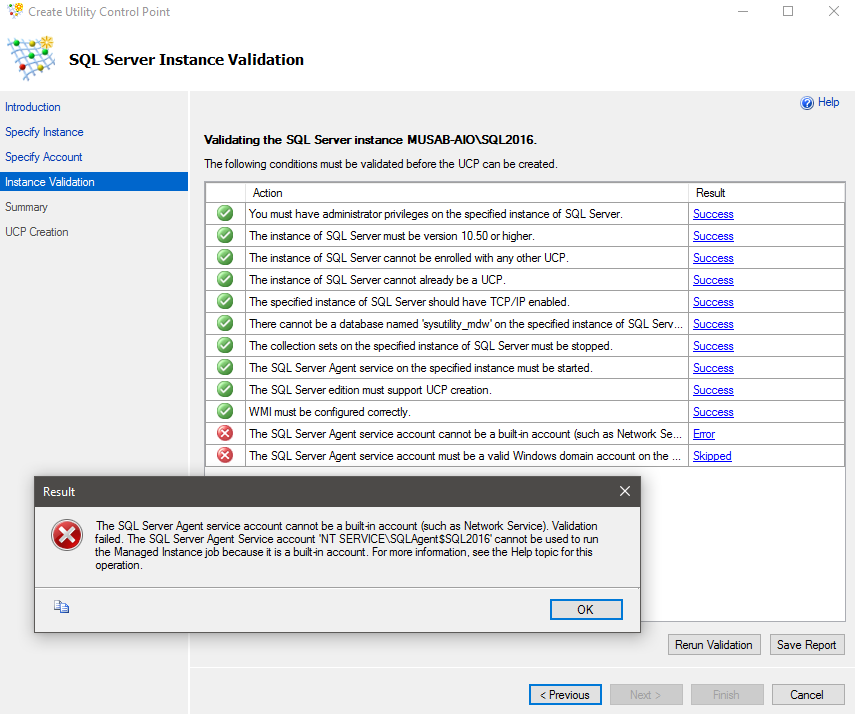
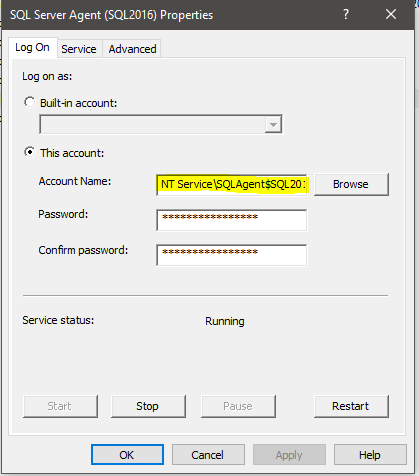
The above-mentioned error is thrown if you have mentioned an account which is not authorized like using a Local Account or Network Service. It’s always a good approach to create a separate domain account for SQL Server Services and mention that account credentials in the wizard at the start.
-
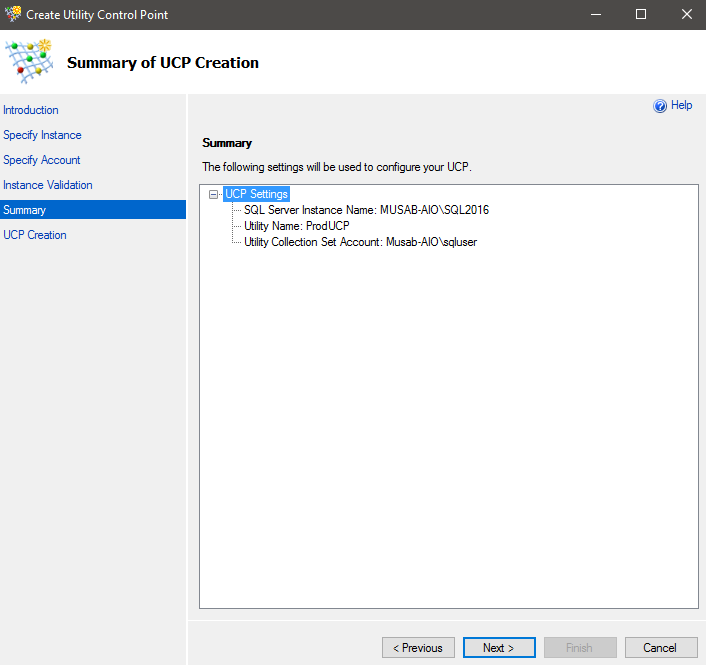
After fixing all the errors (if found any) click the Re-Run Validation and if this is passed you will be presented with the screen mentioned below, for a summary to review. This means you are all set for the installation so click “Next” to start the installation.
-
After finishing the installation, you can go ahead and connect to the newly installed Utility Control Point on your instance by going to Utility Explorer.
-
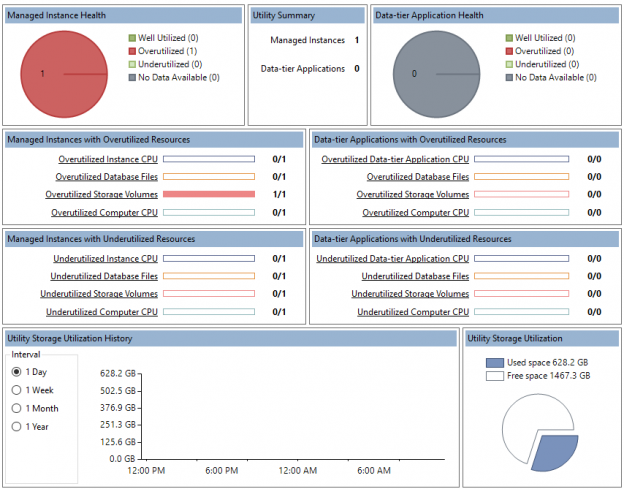
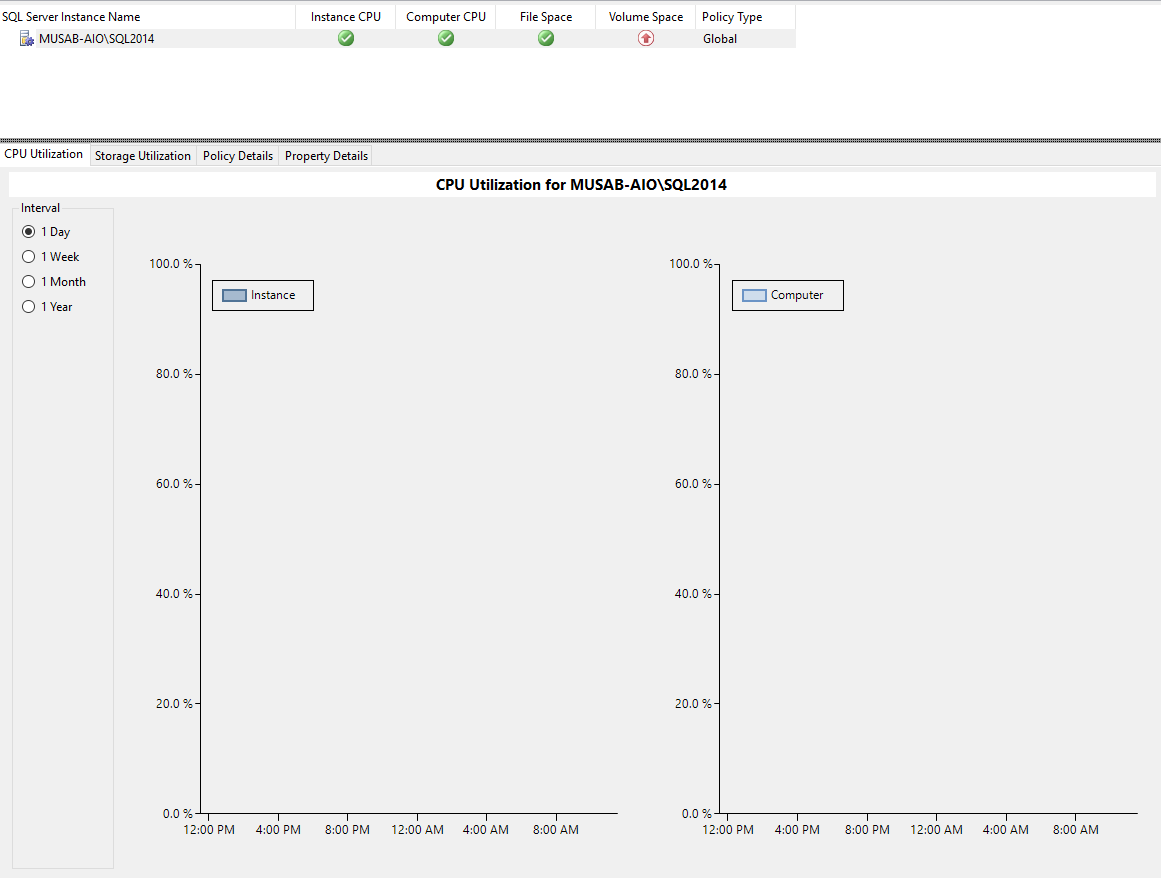
When you connect to the UCP you will see a Dashboard with all the fancy graphs and it will show you only ONE instance which is currently being monitored. This instance is the one on which the UCP is installed. Now you can enroll more instances to monitor.

-
To enroll an instance, click on the “Managed Instances” on the left-hand side in the explorer pan and it will display the managed instances details on the right-hand side. The default view will show you the CPU utilization of the SQL Server Instance “Selected” in the Managed Instance Pan. Now you can view the Resource Utilization and change the interval on the left-hand side from a day (default) to week/month or year.
-
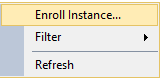
Right click on the black area in the pan under the manager instances and click on “Enroll Instance”. You will have to go through the similar steps which you have seen above while installing the UCP to enroll the new instance.
NOTE: Please note that currently you will only see one instance and it will show you icons (Instance CPU, Computer CPU, File Space & Volume Space) in gray colors as its still collecting the information and it will display the results after the first cycle has completed the data collection which is fifteen minutes by default.
-
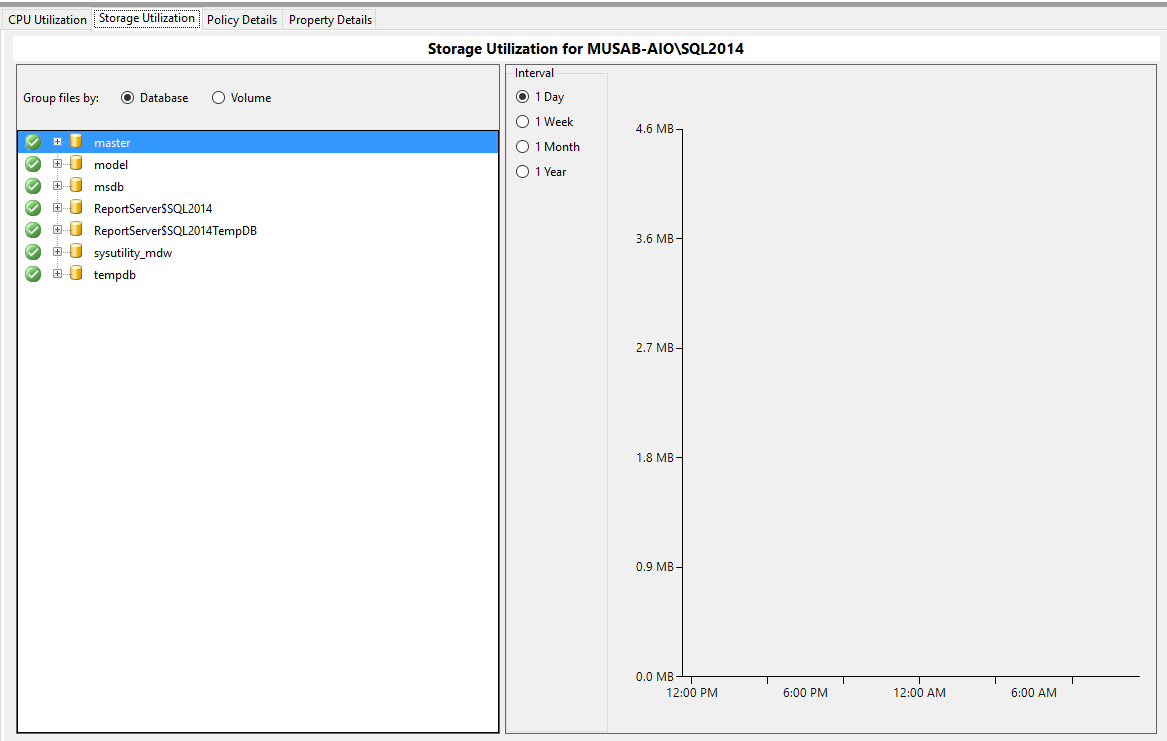
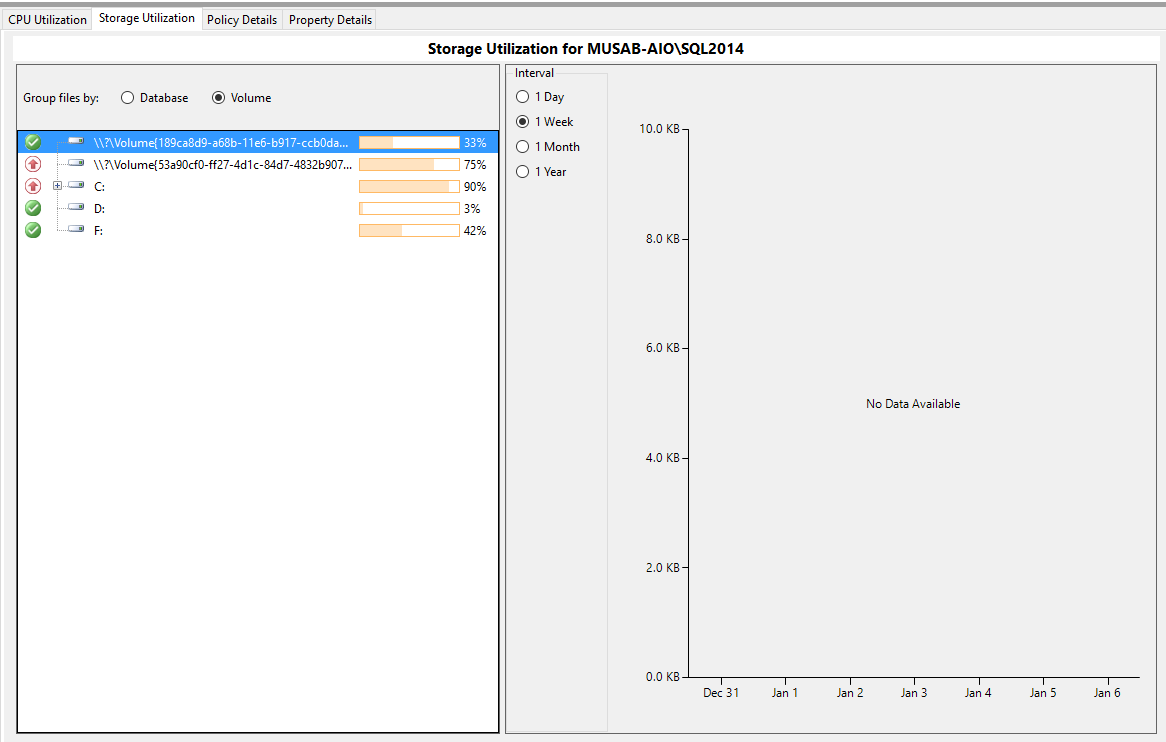
The second view is Storage Utilization which can be viewed by day, week, month or year interval and can be group by Database or the Volume.
-
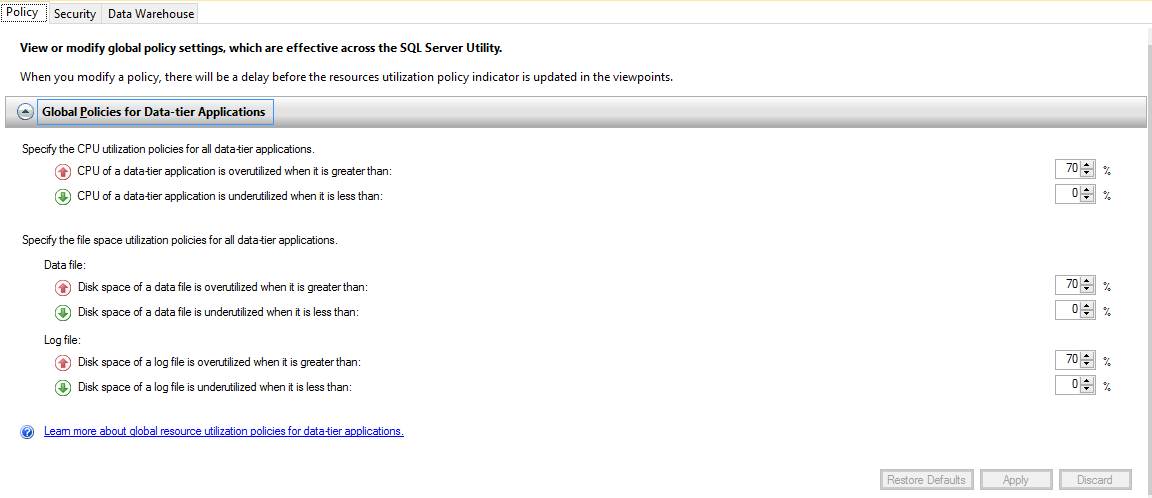
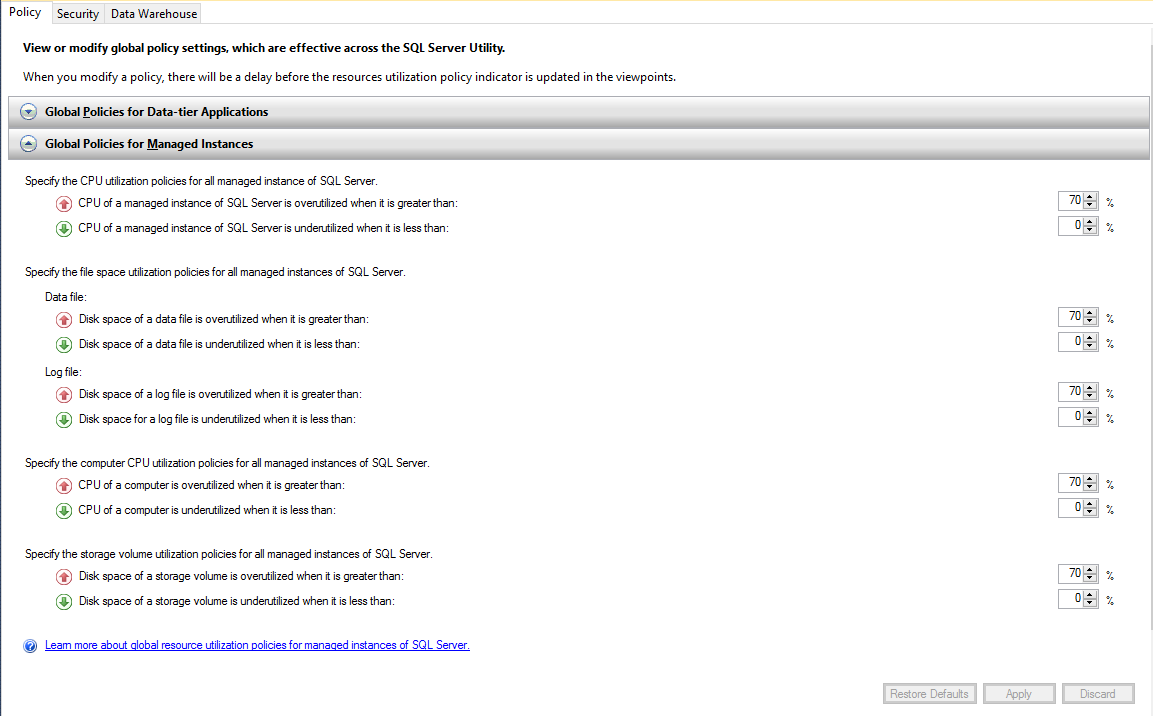
Mentioned below are the Policies you need to view and configure if you need to change the threshold for the UCP. Generally, the default policies are good enough but you can review and change the policies as per your criteria in your organization.
-
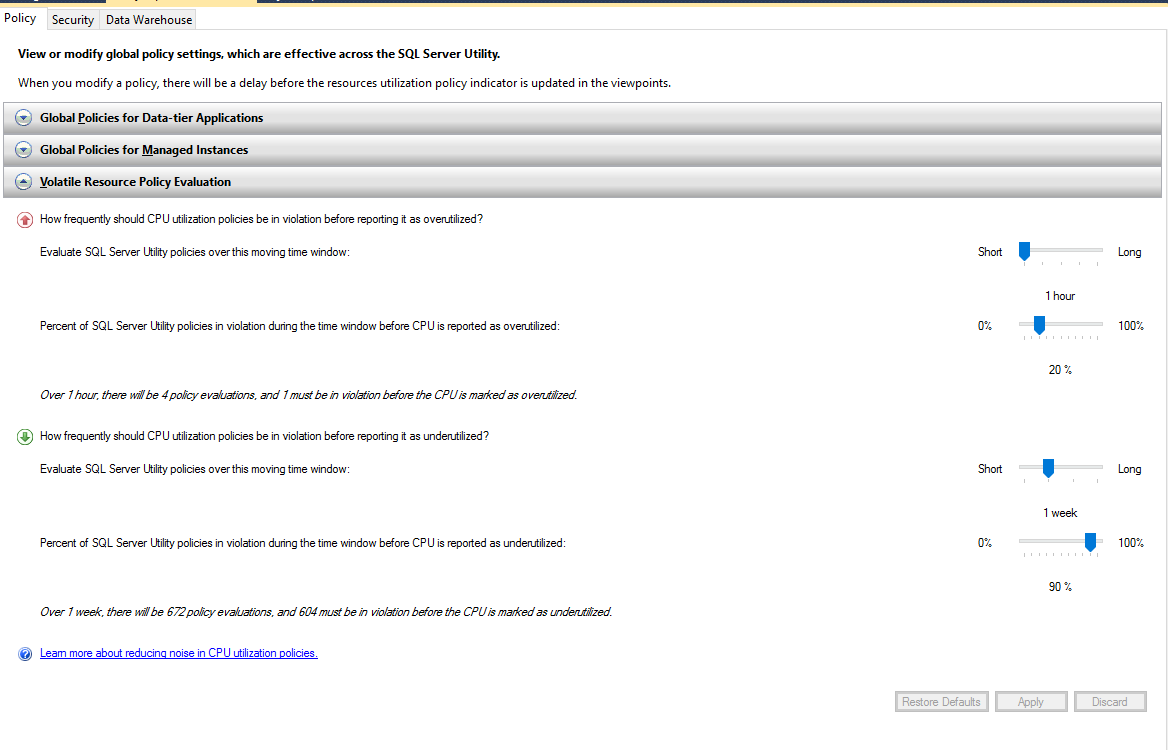
Mentioned below policies are for the Volatile Resource Utilization and also you can set the frequency of how you want
To conclude this article, the discussed feature is one of the very rarely used feature but has a lot of power to give you good power of doing historical analysis about the Resource Utilization. Now you can Instance the UCP in your environment and enroll multiple instances.
He has 9+ Years of Database Development & Administration experience with Medical Billing, Startup & Financial Companies. He is a Microsoft Certified Expert for Data Platform (SQL Server 2012/2014).
Currently, performing duties as Senior SQL Server Consultant at multiple Saudi Private and Governmental Organizations.
View all posts by Musab Umair
- How to identify slow running queries in SQL Server - May 31, 2017
- Adaptive Query Processing in SQL Server 2017 - April 28, 2017
- What is the SQL Server Virtual Log file and how to monitor it - April 26, 2017