
Introduction
To improve performance, it is common for DBAs to search in each aspect except analyzing storage subsystem performance even though in many times, issues are, in fact, caused by poor storage subsystem performance. Therefore, I want to give you some tools and recommendation that you can use it to prevent your storage subsystem from being a performance issue for you.
In this article, I will cover how to measure and analyze your storage subsystem performance and how to test your storage subsystem including
- Main metrics for storage performance
- Operating System Tools to measure storage performance
- SQL Server Tools to measure storage performance
- Using SQL Server to test storage performance
Main metrics for storage performance:
In this section I will introduce the three main metrics for the most storage performance issues as follows:
- Latency
Each IO request will take some time to complete this latency is measured in milliseconds (ms) and should be as low as possible
- IOPS
IOPS means IO operations per second, which means the amount of reading or write operations that could be done in one second. A certain amount of IO operations will also give a certain throughput of Megabytes each second, so these two are related
- Throughputs
The most common value from a disk manufacturer is how much throughput a certain disk can deliver. This number usually expressed in Megabytes / Second (MB/s), and it is simple to believe that this would be the most important factor
Operating System Tools to measure storage performance.
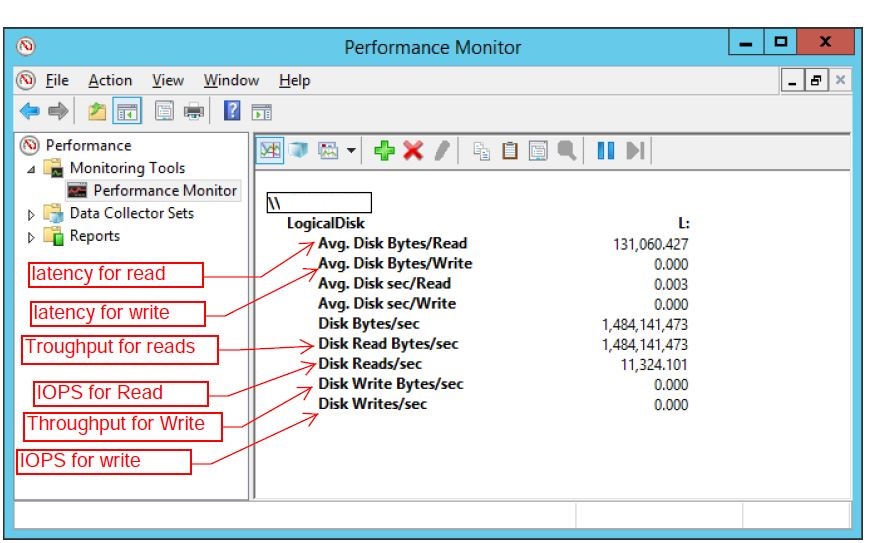
Two main basics Microsoft tools dedicated to analyzing the measure storage subsystem performance in Windows are windows performance monitor and windows resource monitor.
Windows Performance Monitor is a Microsoft Management Console (MMC) that you can use to monitor application and hardware performance in real time. It also provides a disk-level disk performance monitor. For more details, look it here Overview of Windows Performance Monitor
Microsoft Windows Resource Monitor displays information about the use of hardware (CPU, memory, disk, and network) and software (file handles and modules) resources in real time. However, it differs from Windows Performance Monitor as it provides you with information on the file-level

SQL Server Tools to measure storage performance.
Another tool you can use to measure your storage subsystem performance is a set of SQL Server diagnostic T-SQL queries. I will use here one of the SQL Server tools; it is called DMV T-SQL { SQL Server Dynamic Management views } It consists of built-in views in SQL Server that we can use to measure our storage subsystem performance. This tools will let you collect some very useful data about your storage subsystem performance from a SQL Server perspective.
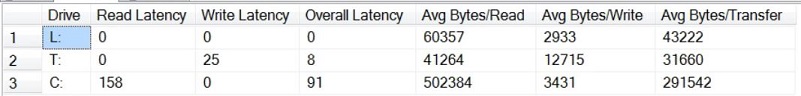
Check Drive level latency:
By this query, we will able to check the drive latency information for reads and writes, in milliseconds and based on my experience I found that the Latency above 20-25ms is usually a problem
- brilliant: < 1ms
- great: < 5ms
- good quality: 5 – 10ms
- Poor: 10 – 20ms
- horrific: 20 – 100ms
- disgracefully bad: 100 – 500ms
- WOW!: > 500ms
|
1 2 3 4 5 6 7 8 9 10 11 12 13 14 15 16 17 18 19 20 21 22 23 24 25 26 27 28 29 30 31 32 33 34 35 36 37 38 39 40 41 42 43 44 45 46 47 48 49 |
Create Table #DiskInformation (DISK_Drive char(100),DISK_num_of_reads int, DISK_io_stall_read_ms int, DISK_num_of_writes int , DISK_io_stall_write_ms int , DISK_num_of_bytes_read int, DISK_num_of_bytes_written int, DISK_io_stall int) insert into #DiskInformation (DISK_Drive ,DISK_num_of_reads , DISK_io_stall_read_ms , DISK_num_of_writes , DISK_io_stall_write_ms , DISK_num_of_bytes_read ,DISK_num_of_bytes_written , DISK_io_stall) SELECT LEFT(UPPER(mf.physical_name), 2) AS DISK_Drive, SUM(num_of_reads) AS DISK_num_of_reads, SUM(io_stall_read_ms) AS DISK_io_stall_read_ms, SUM(num_of_writes) AS DISK_num_of_writes, SUM(io_stall_write_ms) AS DISK_io_stall_write_ms, SUM(num_of_bytes_read) AS DISK_num_of_bytes_read, SUM(num_of_bytes_written) AS DISK_num_of_bytes_written, SUM(io_stall) AS io_stall FROM sys.dm_io_virtual_file_stats(NULL, NULL) AS vfs INNER JOIN sys.master_files AS mf WITH (NOLOCK) ON vfs.database_id = mf.database_id AND vfs.file_id = mf.file_id GROUP BY LEFT(UPPER(mf.physical_name), 2) SELECT DISK_Drive, CASE WHEN DISK_num_of_reads = 0 THEN 0 ELSE (DISK_io_stall_read_ms/DISK_num_of_reads) END AS [Read Latency], CASE WHEN DISK_io_stall_write_ms = 0 THEN 0 ELSE (DISK_io_stall_write_ms/DISK_num_of_writes) END AS [Write Latency], CASE WHEN (DISK_num_of_reads = 0 AND DISK_num_of_writes = 0) THEN 0 ELSE (DISK_io_stall/(DISK_num_of_reads + DISK_num_of_writes)) END AS [Overall Latency], CASE WHEN DISK_num_of_reads = 0 THEN 0 ELSE (DISK_num_of_bytes_read/DISK_num_of_reads) END AS [Avg Bytes/Read], CASE WHEN DISK_io_stall_write_ms = 0 THEN 0 ELSE (DISK_num_of_bytes_written/DISK_num_of_writes) END AS [Avg Bytes/Write], CASE WHEN (DISK_num_of_reads = 0 AND DISK_num_of_writes = 0) THEN 0 ELSE ((DISK_num_of_bytes_read + DISK_num_of_bytes_written)/(DISK_num_of_reads + DISK_num_of_writes)) END AS [Avg Bytes/Transfer] from #DiskInformation ORDER BY [Overall Latency] OPTION (RECOMPILE); Drop table #DiskInformationa |
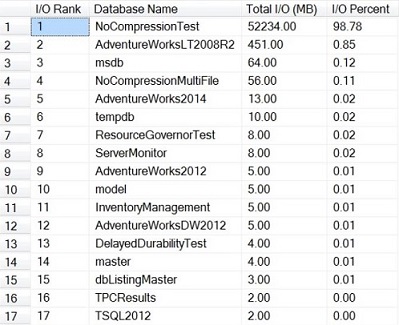
Check I/O utilization by database
This query will give us good indicator about which database is using the most IO resources on my server.
|
1 2 3 4 5 6 7 8 9 10 11 12 |
WITH AggregateIOStatistics AS (SELECT DB_NAME(database_id) AS [DB Name], CAST(SUM(num_of_bytes_read + num_of_bytes_written)/1048576 AS DECIMAL(12, 2)) AS io_in_mb FROM sys.dm_io_virtual_file_stats(NULL, NULL) AS [DM_IO_STATS] GROUP BY database_id) SELECT ROW_NUMBER() OVER(ORDER BY io_in_mb DESC) AS [I/O Rank], [DB Name], io_in_mb AS [Total I/O (MB)], CAST(io_in_mb/ SUM(io_in_mb) OVER() * 100.0 AS DECIMAL(5,2)) AS [I/O Percent] FROM AggregateIOStatistics ORDER BY [I/O Rank] |

Check I/O Statistics by file for the current database:
This query helps you characterize your workload better from an I/O perspective for this database. Also, it helps you to determine whether you have an OLTP or DW/DSS type of workload
|
1 2 3 4 5 6 7 8 9 10 11 12 13 14 15 16 |
SELECT DB_NAME(DB_ID()) AS [DB_Name], DFS.name AS [Logical_Name], DIVFS.[file_id], DFS.physical_name AS [PH_Name], DIVFS.num_of_reads, DIVFS.num_of_writes, DIVFS.io_stall_read_ms, DIVFS.io_stall_write_ms, CAST(100. * DIVFS.io_stall_read_ms/(DIVFS.io_stall_read_ms + DIVFS.io_stall_write_ms) AS DECIMAL(10,1)) AS [IO_Stall_Reads_Pct], CAST(100. * DIVFS.io_stall_write_ms/(DIVFS.io_stall_write_ms + DIVFS.io_stall_read_ms) AS DECIMAL(10,1)) AS [IO_Stall_Writes_Pct], (DIVFS.num_of_reads + DIVFS.num_of_writes) AS [Writes + Reads], CAST(DIVFS.num_of_bytes_read/1048576.0 AS DECIMAL(10, 2)) AS [MB Read], CAST(DIVFS.num_of_bytes_written/1048576.0 AS DECIMAL(10, 2)) AS [MB Written], CAST(100. * DIVFS.num_of_reads/(DIVFS.num_of_reads + DIVFS.num_of_writes) AS DECIMAL(10,1)) AS [# Reads Pct], CAST(100. * DIVFS.num_of_writes/(DIVFS.num_of_reads + DIVFS.num_of_writes) AS DECIMAL(10,1)) AS [# Write Pct], CAST(100. * DIVFS.num_of_bytes_read/(DIVFS.num_of_bytes_read + DIVFS.num_of_bytes_written) AS DECIMAL(10,1)) AS [Read Bytes Pct], CAST(100. * DIVFS.num_of_bytes_written/(DIVFS.num_of_bytes_read + DIVFS.num_of_bytes_written) AS DECIMAL(10,1)) AS [Written Bytes Pct] FROM sys.dm_io_virtual_file_stats(DB_ID(), NULL) AS DIVFS INNER JOIN sys.database_files AS DFS WITH (NOLOCK) ON DIVFS.[file_id]= DFS.[file_id] ; |

Using SQL Server to test storage performance.
There are different methods you can use it to test and benchmark your storage subsystem like Microsoft DiskSpd and CrystalDiskMark (for more information about DISKSPD tool check this article SQL Server performance – measure Disk Response Time). We can also use SQL Server directly to test storage subsystem performance.
Flush dirty pages: we might have in the buffer pool
|
1 2 3 |
CHECKPOINT; |
Flush the buffer cache
Flush the buffer cache will flush everything out of your buffer pool which forces you to read the data from your storage subsystem when you run a query later on
|
1 2 3 4 |
DBCC DROPCLEANBUFFERS; GO |
Turn on Statistics IO and Statistics time: important for some of the calculations we’ll do later.
|
1 2 3 4 5 |
SET STATISTICS IO ON; SET STATISTICS TIME ON; GO |
Fetching the data Count: Select row counts from any table with an index hint that forces it to do a clustered index scan if there’s clustered index or table scan if there isn’t as an example:
|
1 2 3 4 |
SELECT COUNT(*) AS [Row Count] FROM dbo.OnlineSearchHistoryNonCompressed WITH (INDEX(0)); |
- • Check the messages results: If we go to the messages tab, we can see the number of logical reads and the physical reads and the readahead reads.

Calculate sequential read throughput from IO and time statistics: We will do it using this formula:
8 (KB/page) * (physical reads + read-ahead reads)/(elapsed time in ms)
|
1 2 3 |
SELECT 8 * (2 + 2331799)/36241 AS [MB/sec Sequential Read Throughput]; |
the result will be 514 MB/sec
Calculate the elapsed time in seconds: We will do it using this formula:
Table size in MB/read rate (MB/s) = Elapsed time in seconds
|
1 2 3 |
SELECT (18624424/1024.0)/514 AS [ Elapsed Time in Seconds]; |
The result about 35.39 seconds
In the end, the idea here is that you can run this test and then actually see in real life how long it takes to do a sequential read in a whole bunch of data of your IO subsystem and you can see how much sequential throughput you can get out of it when you run this test.
Conclusion
When you face any performance issue, keep in your mind the relation between performance and subsystem storage and try to use the previous tools in this article, not just for solving the performance problem but to proactively head off potential problems in the future as well

Currently, he is working as a Senior consultant production DBA and Development DBA in many projects in multiple government sectors. He is a Top SQL Server blogger in the Middle East, founder of the community mostafaelmasry.com, and is the second Arabic author on Microsoft MSDN in SQL Server.
Based on his current position, he solved fairly interesting problems on fairly large databases and highly sensitive performance cases.
View all posts by Mustafa EL-Masry
- Concept and basics of DBCC Commands in SQL Server - March 31, 2017
- Hybrid Cloud and Hekaton Features in SQL Server 2014 - February 28, 2017
- How to analyze Storage Subsystem Performance in SQL Server - February 23, 2017