
There are certain scenarios when the query is automatically removed from cache, so the next time the query is called, SQL Server will not find its query execution plan in cache and will have to recompile it.
Whenever SQL Server is restarted, all query execution plans stored in cache are removed from cache.
Excessive SQL Server activity. New queries are compiled, added to cache which size is limited, so at a point, the old query execution plans are moved out of cache to make space for the new ones.
When a database that contains the stored procedure, or any object referenced by the query is restored.
When a schema of an object referenced by the query is changed. These changes include:
Table and view column changes (a column added or dropped)
Index changes
Constraint, defaults, and rule changes
Triggers created or dropped
Table statistics drops
When a table referenced by the query has more data changes than specified by the threshold. The threshold can be changed using the KEEP PLAN query hint, as described in Frequent query recompilations – a SQL query performance killer –introduction
When you execute a query or stored procedure where a schema change is followed by a data operation, such as SELECT, INSERT, UPDATE, or DELETE. In other words, when DDL (Data Definition Language) statements are interleaved with DML (Data Manipulation Language) statements. The query will be recompiled when it reaches the first data operation.
|
1 2 3 4 5 6 7 8 9 10 11 12 13 14 15 16 17 18 |
CREATE PROCEDURE TestRecomp AS BEGIN -- DDL statement CREATE TABLE TestTab( id int, cola int, colb nvarchar(30)) SELECT * FROM TestTab -- DML statement - the first recompilation ALTER TABLE TestTab ADD colc datetime -- Another DDL statement - the second recompilation SELECT id FROM TestTab -- DML - the third recompilation END |
When you run
|
1 2 3 |
EXEC TestRecomp |
There will be three recompilations, as indicated in the comments
When a SET option is changed
It’s recommended not to save any of SET options (ANSI_NULLS, Quoted_identifier, etc.) in a stored procedure, as they cause recompilation
Since SQL Server 2005, only the statement that causes a recompilation is recompiled. This is a statement-level recompilation. In the earlier versions, all statements in the stored procedure were recompiled, which affected SQL Server performance even more.
Detecting recompilations using Windows Performance Monitor
Windows Performance Monitor can be used to track both compilations and recompilations.
The metric that tracks the number of compilations per second is SQL Compilations/Sec. It’s located in the SQL Server Statistics section. The metric shows the number of query and procedure compilations in a second. It’s expected that the value is high on SQL Server start up, but is should fall and stabilize after a while.
The metric that shows the number of query and procedure recompilations in a second is SQL Re-Compilations/Sec. A high value is a clear indication of frequent recompilations that lead to processor stress and SQL Server performance degradation.
The ideal value for the number of recompilations per second is zero. There is no specific threshold value. You should watch for the metric trend and set a baseline. However, it is also recommended to have the Compilations/sec value to be less than 10% of the Batch Requests/sec value. Another recommendation is that the number of Recompilations/sec should be less than 10% of Compilations/sec.
If the values are constantly high, further investigation is required.
- Start Windows Performance Monitor, using one of the following methods:
- Open Start (Windows + C for Windows 8), select Search, type perfmon, and press Enter
- Open Start, Run (Windows + R for Windows 8), type perfmon, and press Enter
- Open Control Panel, select System and Security, Administrative Tools, and click Performance Monitor
- Select Monitoring Tools, Performance Monitor in the left pane
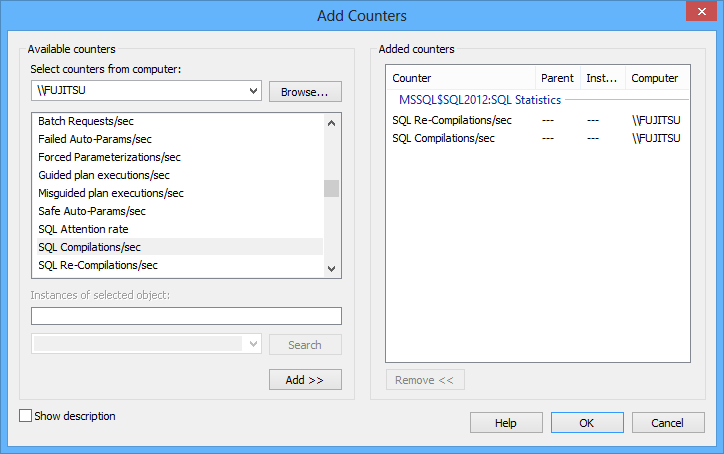
- Click the Add icon in the menu
- In the Add counters dialog select the machine name in the drop-down list
- In the list of available counters, select MSSQL$<sql server instance>: SQL Statistics
-
Expand the list, select SQL Re-Compilations/sec, and click Add. To track the recompilations as well, select SQL Compilations/sec

-
Click OK
The Performance Monitor graph will show the number of compilations and recompilations per second.
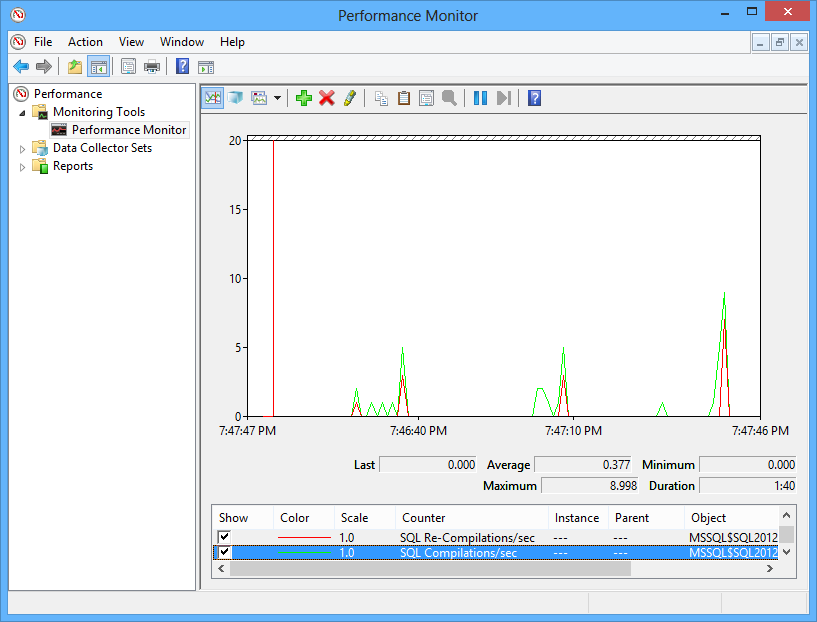
The advantages of Performance Monitor are that it is available in Windows Server 2003 and later and easy to use. It shows the graphs in real-time, adds little overhead, and you can monitor only specific counters. Although it clearly shows the number of recompilations, it doesn’t show the queries and stored procedures recompiled, which is necessary for troubleshooting.
Detecting recompilations using sys.dm_os_performance_counters
The SQL Compilations/Sec and SQL Re-Compilations/Sec metrics are also available in the sys.dm_os_performance_counters dynamic management view.
As it’s useful to compare the number of recompilations to the number of compilations and batch requests, select all three metrics.
|
1 2 3 4 5 |
SELECT * FROM sys.dm_os_performance_counters WHERE counter_name IN('Batch Requests/sec', 'SQL Compilations/sec', 'SQL Re-Compilations/sec') |
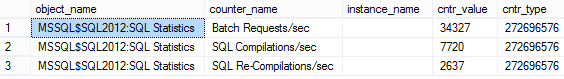
The counter type value 272696576 indicates these are cumulative values since the last SQL Server restart, and should be recalculated to get the number per second. We’ll use a 10 second sampling.
|
1 2 3 4 5 6 7 8 9 10 11 12 13 |
DECLARE @CountVal BIGINT; SELECT @CountVal = cntr_value FROM sys.dm_os_performance_counters WHERE counter_name = 'SQL Re-Compilations/sec'; WAITFOR DELAY '00:00:10'; SELECT (cntr_value - @CountVal) / 10 AS 'SQL Re-Compilations/sec' FROM sys.dm_os_performance_counters WHERE counter_name = 'SQL Re-Compilations/sec'; |
Again, there’s no information about the queries and stored procedures that are recompiled, which is necessary for troubleshooting
Detecting recompilations using SQL Server Profiler
Recompilations are captured in SQL Server traces. To find out whether a recompilation has occurred, use SQL Server Profiler to read the traces.
- Start SQL Server Profiler
- On the File menu, select New Trace
- In the Connect to Server dialog, select the SQL Server instance and provide credentials
- Click Connect
-
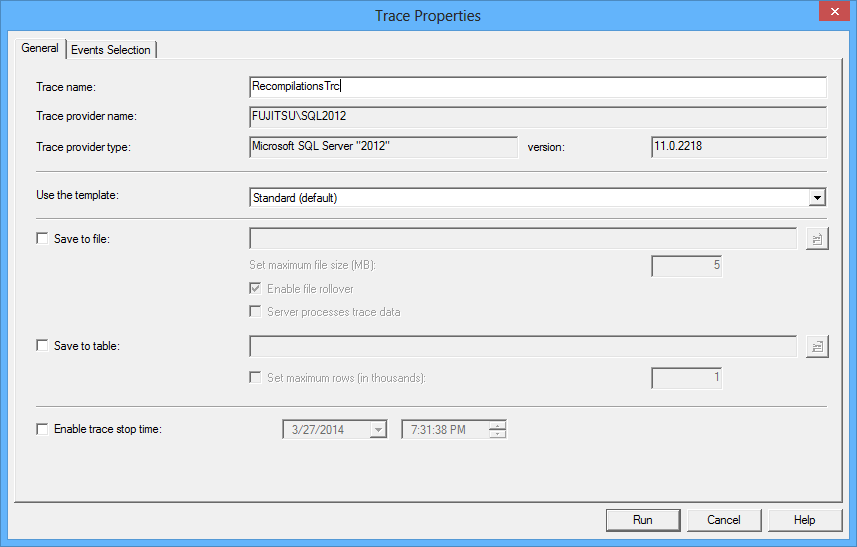
In the General tab, specify the trace name
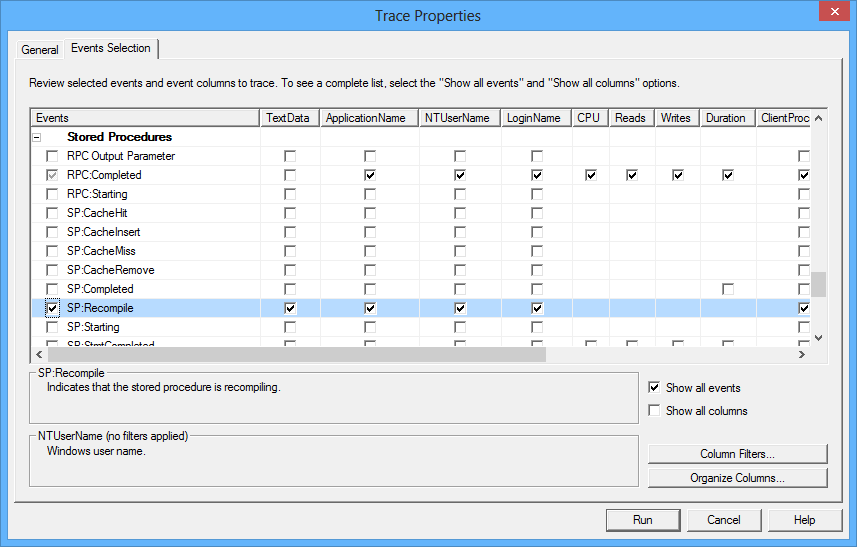
Open the Events Section tab
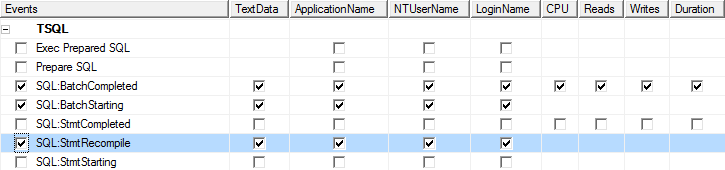
Note that recompilations are not captured into SQL traces by default. To capture them, you have to select them manually.
- Select the Show All Events checkbox
- In the Events grid, scroll down to the Stored Procedures node and expand it
-
Select the SP:Recompile row
This option is only for tracking recompilations on stored procedures
-
To track recompilations on ad hoc queries, expand the TSQL node and select the SQL:Stmt Recompile row
- Click Run
The stored procedure recompilations are shown as SP:Recompile event class. The statement that is recompiled is shown in the text data column, as well as in the lower pane of the SQL Server Profiler window.
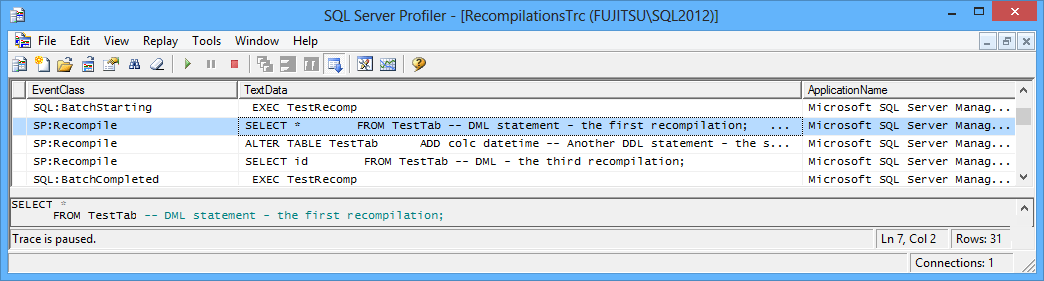
Ad hoc query recompilations are shown as the SQL:Stmt Recompile event class.
SQL Server Profiler offers the Find option to search for the specific events, but it doesn’t enable filtering by a specific event class which would make recompilation analysis easier. The statements recompiled are shown, so that can be used to find the most often recompiled queries and stored procedures. The downside of this method is that running SQL Server traces can add overhead to SQL Server performance.
In this article, we showed when the recompilation occurs automatically. We also presented three different methods that can be used for monitoring recompilations. Windows Performance Monitor and sys.dm_os_performance_counters view show the number or recompilations in a second, but cannot be used for deeper analysis and troubleshooting. SQL Server Profiler shows the recompiled statements, therefore provides enough information for further investigation.

She has been working with SQL Server since 2005 and has experience with SQL 2000 through SQL 2014.
Her favorite SQL Server topics are SQL Server disaster recovery, auditing, and performance monitoring.
View all posts by Milena "Millie" Petrovic
- Using custom reports to improve performance reporting in SQL Server 2014 – running and modifying the reports - September 12, 2014
- Using custom reports to improve performance reporting in SQL Server 2014 – the basics - September 8, 2014
- Performance Dashboard Reports in SQL Server 2014 - July 29, 2014