
As a continuation to my previous article, How to use Python in SQL Server 2017 to obtain advanced data analytics, a little bit of curiosity about Deep Learning with Python integration in SQL Server led me to write this latest article.
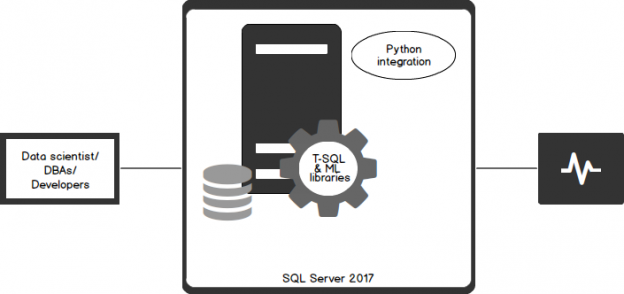
With Python running within SQL Server, you can bring the existing data and the code together. Data is accessible directly, so there’s no need to extract query data sets, moving data from storage to the application. It’s a useful approach, especially considering issues of data sovereignty and compliance, since the code runs within the SQL Server security boundaries, triggered by a single call from T-SQL stored procedures.
As we’re all aware, Microsoft is now taking some steps that had us surprised, one of them being the release of SQL Server 2017 to Linux. In an attempt to expand the horizons, Microsoft has brought in Python capabilities within SQL Server. Python is a language that is easily learned and it packs a lot of potentials. There’s no better time to learn Python, since enterprises are already changing gears to use IT to better derive value from their businesses data.
Machine learning and artificial intelligence (AI) may sound intimidating but actually, it’s a great value-add to organizations in the areas such as web search, financial prediction, fraud detection, digitization etc. There is a lot of hype around deep learning and AI, and the question, whether to use it or not to use it but one thing we can all agree upon is that analytics is of a lot of value to businesses.
It’s really hard to say at the initial stage how well this integration with SQL Server would be or how well SQL Server can withstand the data science design and methodology, but it sure is an interesting feature and a highly rated data science product to be tested in SQL Server 2017.

The available options made me execute several Python samples and create a few data mining examples to understand the core concepts of data analytics. As I mentioned in my previous article How to use Python in SQL Server 2017 to obtain advanced data analytics, it’s all about data loading and data transformation. If the model is huge, one may have a hard time loading the data and transferring it over the network. Hence, data scientists do their predictive analysis using the sampling method.
If you are a database administrator interested in leveraging data science, your first question would be, “Where do I start and how?”
Where to begin
As a database administrator, the thought of concepts of Data Science may seem overwhelming. Worry not; we’ll start small with simple examples. Let’s pick interpolation. Interpolation is like filling in the blanks, in a series. We look at the data surrounding the blank and predict what might be the right data to fill in. This requires some meaningful analysis of the context of the data.
In this article, we’re going to try some interpolation and transformation operations using Python, which covers:
- Demonstration of the execution of a Python script in SQL Server
- Importing modules and loading data into the dataset using the Python script
- Data aggregation using Python nodules
- Working with JSON files
- Pivoting SQL data
- And more….
Getting started
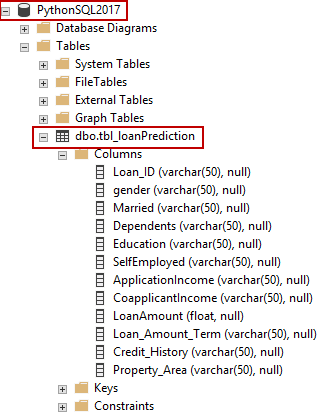
In this article, we’re going to use a SQL table called “Loan Prediction”. Let’s say that this table already has some data in it.
We first need to run some data munging operations on it. Data Munging is a process of exploration of data, identifying issues with it, and fixing the same before it can be used as a model. Next, we need to validate and build relationships between attributes.
Let us start the demo by meeting the prerequisites of the data cleansing and loading.
Data loading
Create the table tbl_loanPrediction
|
1 2 3 4 5 6 7 8 9 10 11 12 13 14 15 16 |
DROP TABLE IF EXISTS dbo.[LoanPrediction] GO CREATE TABLE [dbo].[tbl_loanPrediction] ( Loan_ID varchar(50), gender varchar(50), Married varchar(50), Dependents varchar(50), Education varchar(50), SelfEmployed varchar(50), ApplicationIncome varchar(50), CoapplicantIncome varchar(50), LoanAmount float , Loan_Amount_Term varchar(50), Credit_History varchar(50), Property_Area varchar(50) ) |
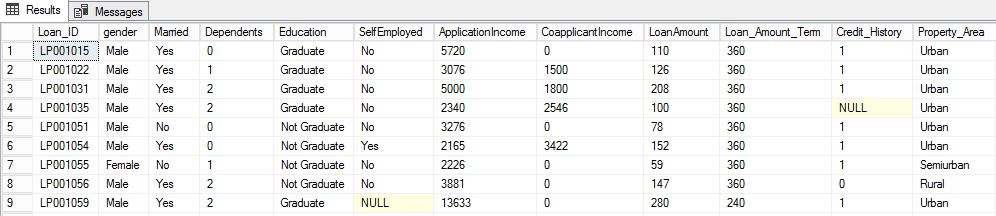
Copy sample data into the CSV file
Let’s create a CSV file with the name loanprediction.csv and add the following content to it. Let’s place the file at E:\ loanprediction.csv.
|
1 2 3 4 5 6 7 8 9 10 11 12 13 |
/* Loan_ID,Gender,Married,Dependents,Education,Self_Employed,ApplicantIncome,CoapplicantIncome,LoanA mount,Loan_Amount_Term,Credit_History,Property_Area LP001015,Male,Yes,0,Graduate,No,5720,0,110,360,1,Urban LP001022,Male,Yes,1,Graduate,No,3076,1500,126,360,1,Urban LP001031,Male,Yes,2,Graduate,No,5000,1800,208,360,1,Urban LP001035,Male,Yes,2,Graduate,No,2340,2546,100,360,,Urban LP001051,Male,No,0,Not Graduate,No,3276,0,78,360,1,Urban LP001054,Male,Yes,0,Not Graduate,Yes,2165,3422,152,360,1,Urban LP001055,Female,No,1,Not Graduate,No,2226,0,59,360,1,Semiurban LP001056,Male,Yes,2,Not Graduate,No,3881,0,147,360,0,Rural LP001059,Male,Yes,2,Graduate,,13633,0,280,240,1,Urban */ |
Loading CSV file into the SQL Table
Using BULK INSERT, load the data into the tbl_loanprediction table
|
1 2 3 4 5 6 7 8 9 10 11 12 13 |
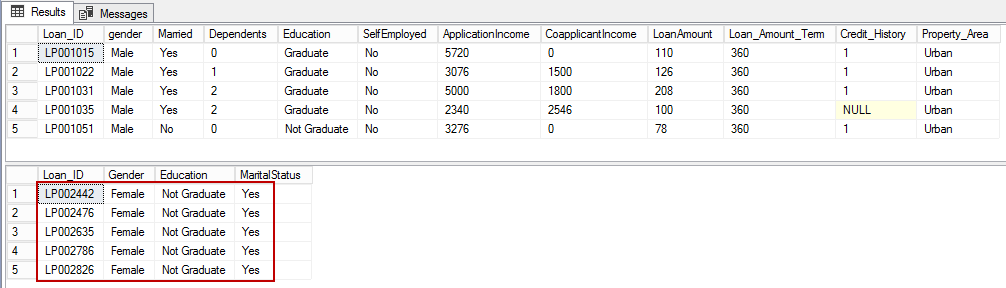
BULK INSERT [tbl_LoanPrediction] FROM 'e:\loanprediction.csv' WITH ( FIELDTERMINATOR = ',', ROWTERMINATOR = '\n' ) GO --Check the content of the table. SELECT * FROM [tbl_LoanPrediction] GO |
Querying the CSV file using PANDAS
PANDAS is an open source, high performance data analysis library for Python
|
1 2 3 4 5 6 |
EXEC sp_execute_external_script @language =N'Python', @script=N' import pandas as pd import numpy as np data = pd.read_csv("e:\loanprediction.csv", index_col="Loan_ID") print(data) |
Data extraction using logical condition
Let us now add some logical conditions and extract some data.
|
1 2 3 4 5 6 |
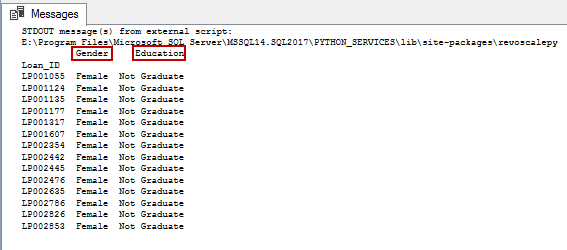
exec sp_execute_external_script @language =N'Python', @script=N' import pandas as pd import numpy as np data = pd.read_csv("e:\loanprediction.csv", index_col="Loan_ID") print(data.loc[(data["Gender"]=="Female") & (data["Education"]=="Not Graduate") , ["Gender","Education"]]) |
Data loading into the Temp table for further processing
In this script, we will add the data to a new table. We will be using the Insert and Exec commands together to fetch the values from the data frames and send them to the new table.
We will use an additional parameter, “@output_data_1_name” to hold the output data that will be used by the Insert command in order to update the newly created table.
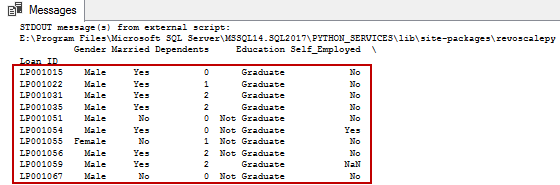
You may want to filter values of a column based on conditions from another set of columns. For instance, we want a list of all females who are not graduate and are married:
|
1 2 3 4 5 6 7 8 9 10 11 12 13 14 15 16 17 18 |
DROP TABLE IF EXISTS dbo.#Loan GO SELECT TOP 5* FROM tbl_LoanPrediction CREATE TABLE #Loan(Loan_ID varchar(20),Gender varchar(10) null, Education varchar(30) null, MaritalStatus char(3)) INSERT INTO #Loan exec sp_execute_external_script @language =N'Python', @script=N' import pandas as pd import numpy as np data = InputDataSet OutputDataSet=data.loc[(data["gender"]=="Female") & (data["Education"]=="Not Graduate") & (data["Married"]=="Yes"), ["Loan_ID","gender","Education","Married"]] ', @input_data_1 = N'SELECT * FROM [tbl_LoanPrediction]' ,@output_data_1_name = N'OutputDataSet' select * from #Loan |
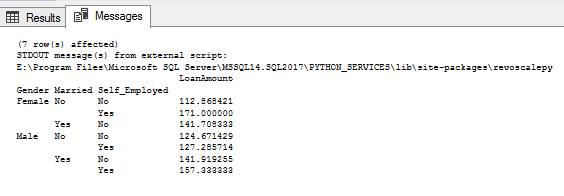
Pivoting
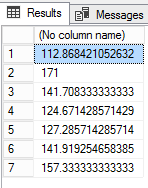
PANDAS can be used to create MS Excel style pivot tables. For instance, in this case, a key column is “LoanAmount” which has missing values. We can compute it using the mean amount of each of “Gender”, “Married” and “Self_Employed” groups. The mean “LoanAmount” of each group can be determined as:
|
1 2 3 4 5 6 7 8 9 10 |
EXEC sp_execute_external_script @language =N'Python', @script=N' import pandas as pd import numpy as np data = pd.read_csv("e:\loanprediction.csv", index_col="Loan_ID") #Determine pivot table OutputDataSet = data.pivot_table(values=["LoanAmount"], index=["Gender","Married","Self_Employed"], aggfunc=np.mean) print(OutputDataSet) ',@output_data_1_name = N'OutputDataSet' |
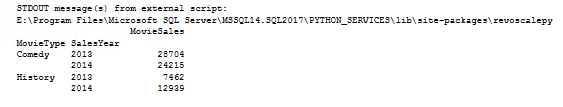
Let us see another example of pivoting. In the below example, the input is a table. Let us now attempt pivoting by transforming the data which is stored in the table.
|
1 2 3 4 5 6 7 8 9 10 11 12 13 14 15 16 17 18 19 20 21 22 23 24 25 26 27 28 29 30 31 32 33 34 35 |
DROP TABLE IF EXISTS dbo.#Movies GO CREATE TABLE #Movies (MovieType VARCHAR(20), SalesYear INT, MovieSales int); GO INSERT INTO #Movies VALUES('Comedy', 2014, 11201); INSERT INTO #Movies VALUES('History', 2014, 12939); INSERT INTO #Movies VALUES('Comedy', 2013, 10436); INSERT INTO #Movies VALUES('Comedy', 2013, 9346); INSERT INTO #Movies VALUES('Comedy', 2014, 7214); INSERT INTO #Movies VALUES('Comedy', 2014, 5800); INSERT INTO #Movies VALUES('Comedy', 2013, 8922); INSERT INTO #Movies VALUES('History', 2013, 7462); SELECT * FROM #Movies; SELECT * FROM #Movies PIVOT(SUM(MovieSales) FOR SalesYear IN([2013], [2014]) ) AS PivotSales; exec sp_execute_external_script @language =N'Python', @script=N' import pandas as pd import numpy as np data = InputDataSet #Determine pivot table OutputDataSet = data.pivot_table(values=["MovieSales"], index=["MovieType","SalesYear"], aggfunc=np.sum) print(OutputDataSet) ', @input_data_1 = N'SELECT * FROM #Movies', @output_data_1_name = N'OutputDataSet' |
Data extraction from JSON file
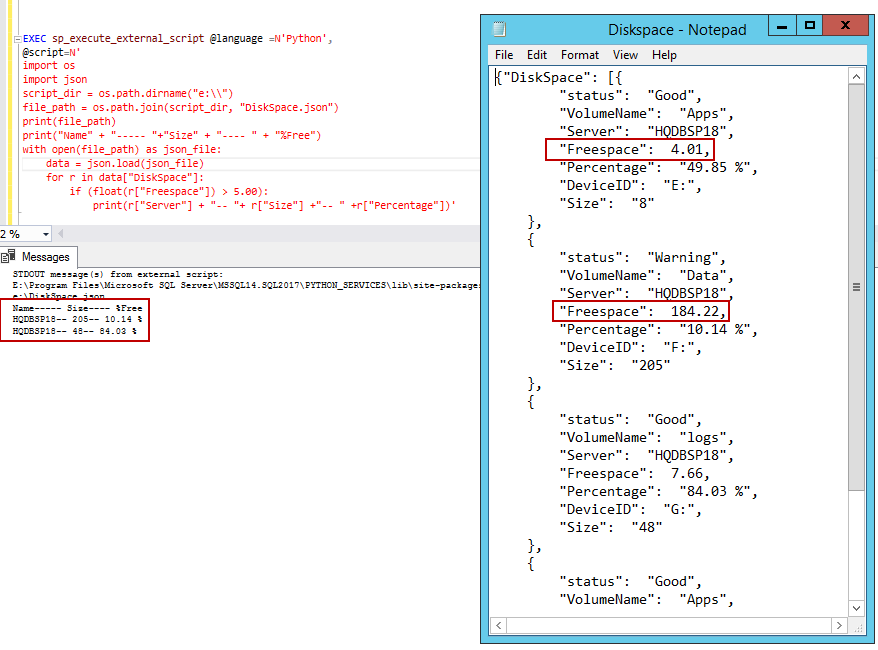
OK, so that was a CSV. What if we wanted to pass the data from a JSON file? That’s possible, too! The path to the JSON file is stored in variable and fed as an input in order to load the JSON file. In this example, the illustration of a looping construct and conditional constructs is shown.
One of the major hurdles for programmers, when they think of making the switch to Python, is that the language does not use braces to indicate blocks of code. Instead, all blocks of code are denoted by indentation. This indentation is a strict function of the language. If you indent with a wrong number of spaces, the program won’t run correctly. So, you need to be very careful writing code in Python. I recommend using comments generously.
|
1 2 3 4 5 6 7 8 9 10 11 12 13 |
EXEC sp_execute_external_script @language =N'Python', @script=N' import os import json script_dir = os.path.dirname("e:\\") file_path = os.path.join(script_dir, "DiskSpace.json") print(file_path) print("Name" + "----- "+"Size" + "---- " + "%Free") with open(file_path) as json_file: data = json.load(json_file) for r in data["DiskSpace"]: if (float(r["Freespace"]) > 5.00): print(r["Server"] + "-- "+ r["Size"] +"-- " +r["Percentage"])' |
Wrapping up
The core of most businesses today is data: structured or unstructured. And when Machine Learning is used to help the business, the vitality of the core data defines its success. It is always essential to understand the nature of the data, the scope and the purpose of the project, and the algorithms used. These factors determine the rate of success of the project.
The rise of data mining, use of data science, data analytics, big data and other trends are reshaping the role of a database administrator. Today’s applications are increasingly data-intensive, relying on diverse data sources, fast transaction processing, and real-time information. The role of IT is ever-evolving.
I hope you found the article useful in showing a demonstration of use of Python with SQL, which could be one of the initial steps to using the methods for data analytics. There may be different approaches or better alternatives to PANDAS in Python. My goal in this article has been to illustrate a few examples which highlight the use of Python along with SQL Server.
Table of contents

My specialty lies in designing & implementing High availability solutions and cross-platform DB Migration. The technologies currently working on are SQL Server, PowerShell, Oracle and MongoDB.
View all posts by Prashanth Jayaram
- Stairway to SQL essentials - April 7, 2021
- A quick overview of database audit in SQL - January 28, 2021
- How to set up Azure Data Sync between Azure SQL databases and on-premises SQL Server - January 20, 2021