
A few days ago I received an interesting challenge from one of our clients. The lady was attempting to estimate her potential monthly revenue recognition for the fiscal year beginning January 1, 2015, through December 31, 2015. The lady named Linda sells goods and services (each class yielding differing sales margins).
In the first portion of this two-part discussion, we shall be looking at the revenue projections for goods.
Linda’s business rules are as follows.
In the month in which a client order for goods is booked (and this may be some time in the ‘future’ say for Christmas time), if the order is placed before the 21st of that month then she ‘claims’ the total revenue for the booked month. Should the order date be greater than the 21st of that month then she claims only 70% and the remaining 30% in the following month.
Our challenge for today’s get together is to create a query that will provide Linda the information that she requires based upon her corporate data.
Let’s get started!
Getting Started
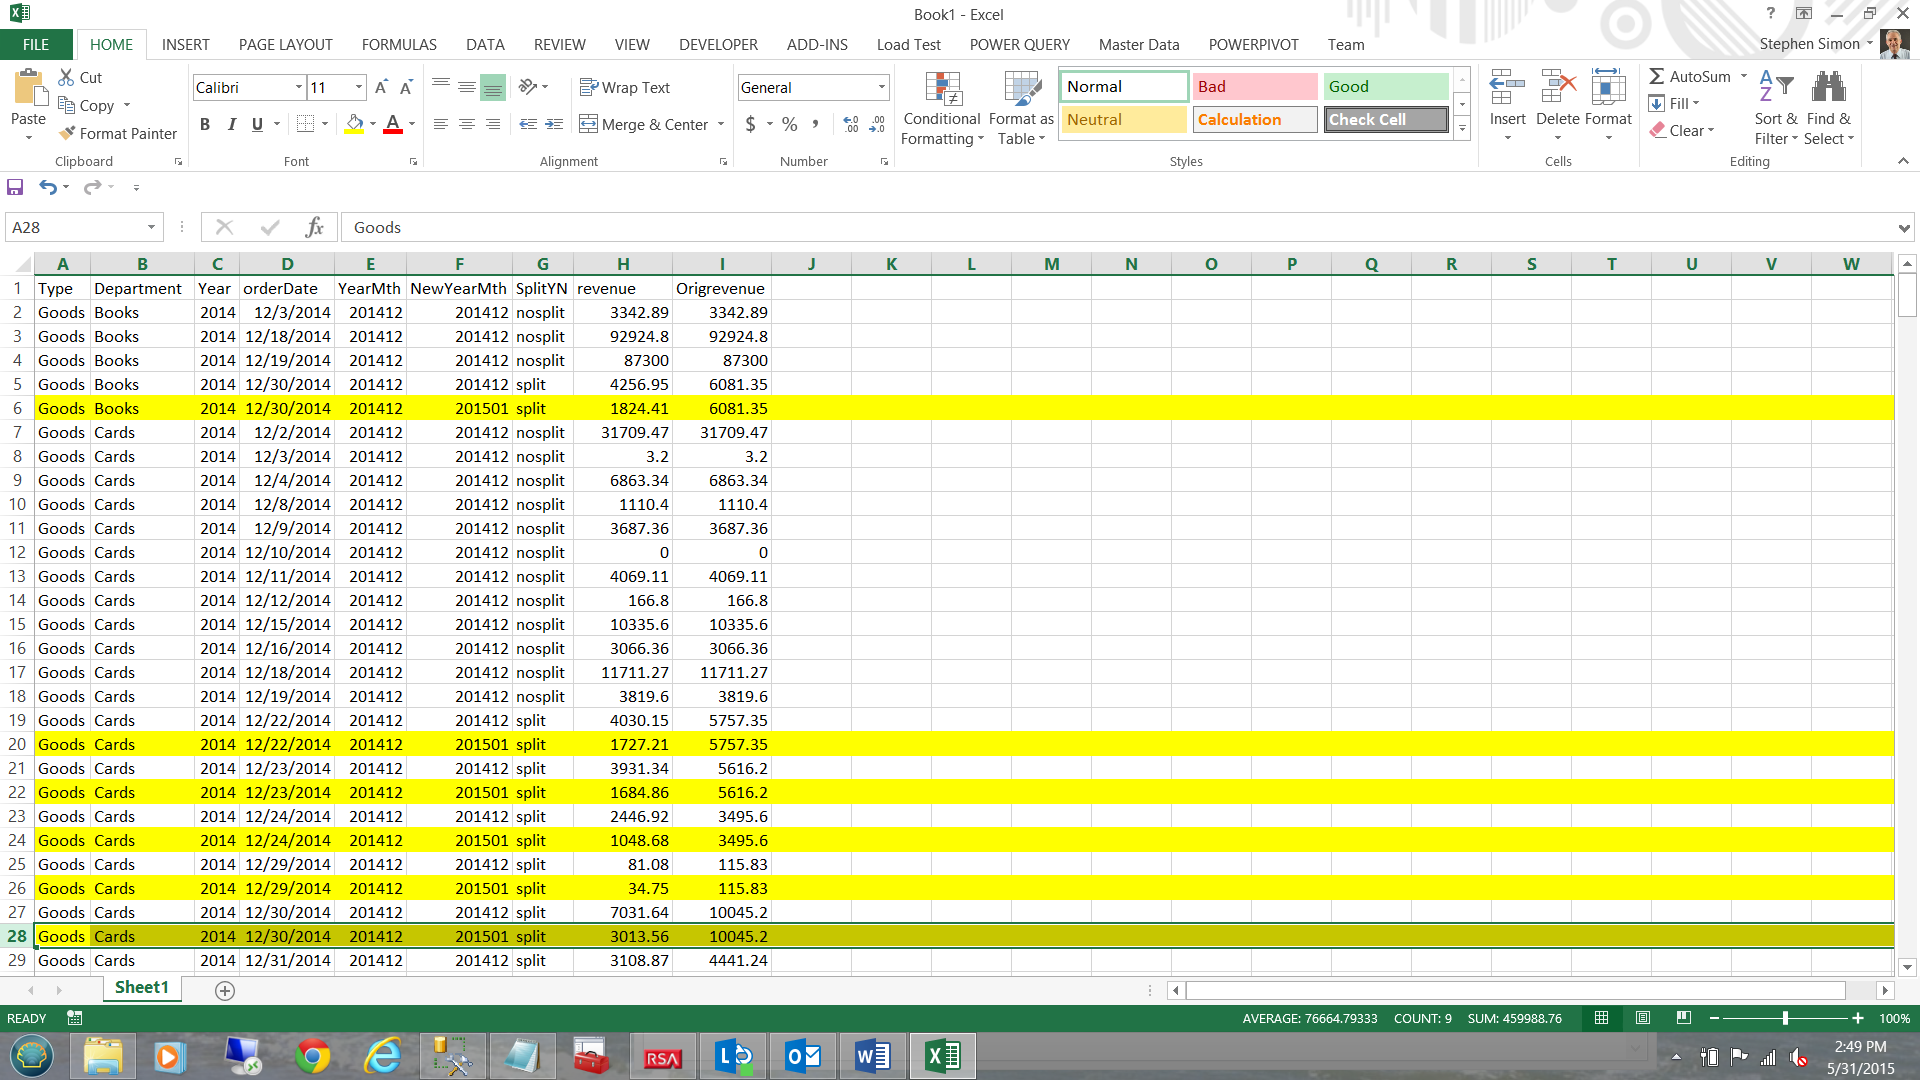
Perhaps the best manner in which to begin is to have a high-level glance at how the final data will appear AFTER applying Linda’s revenue projection rules.
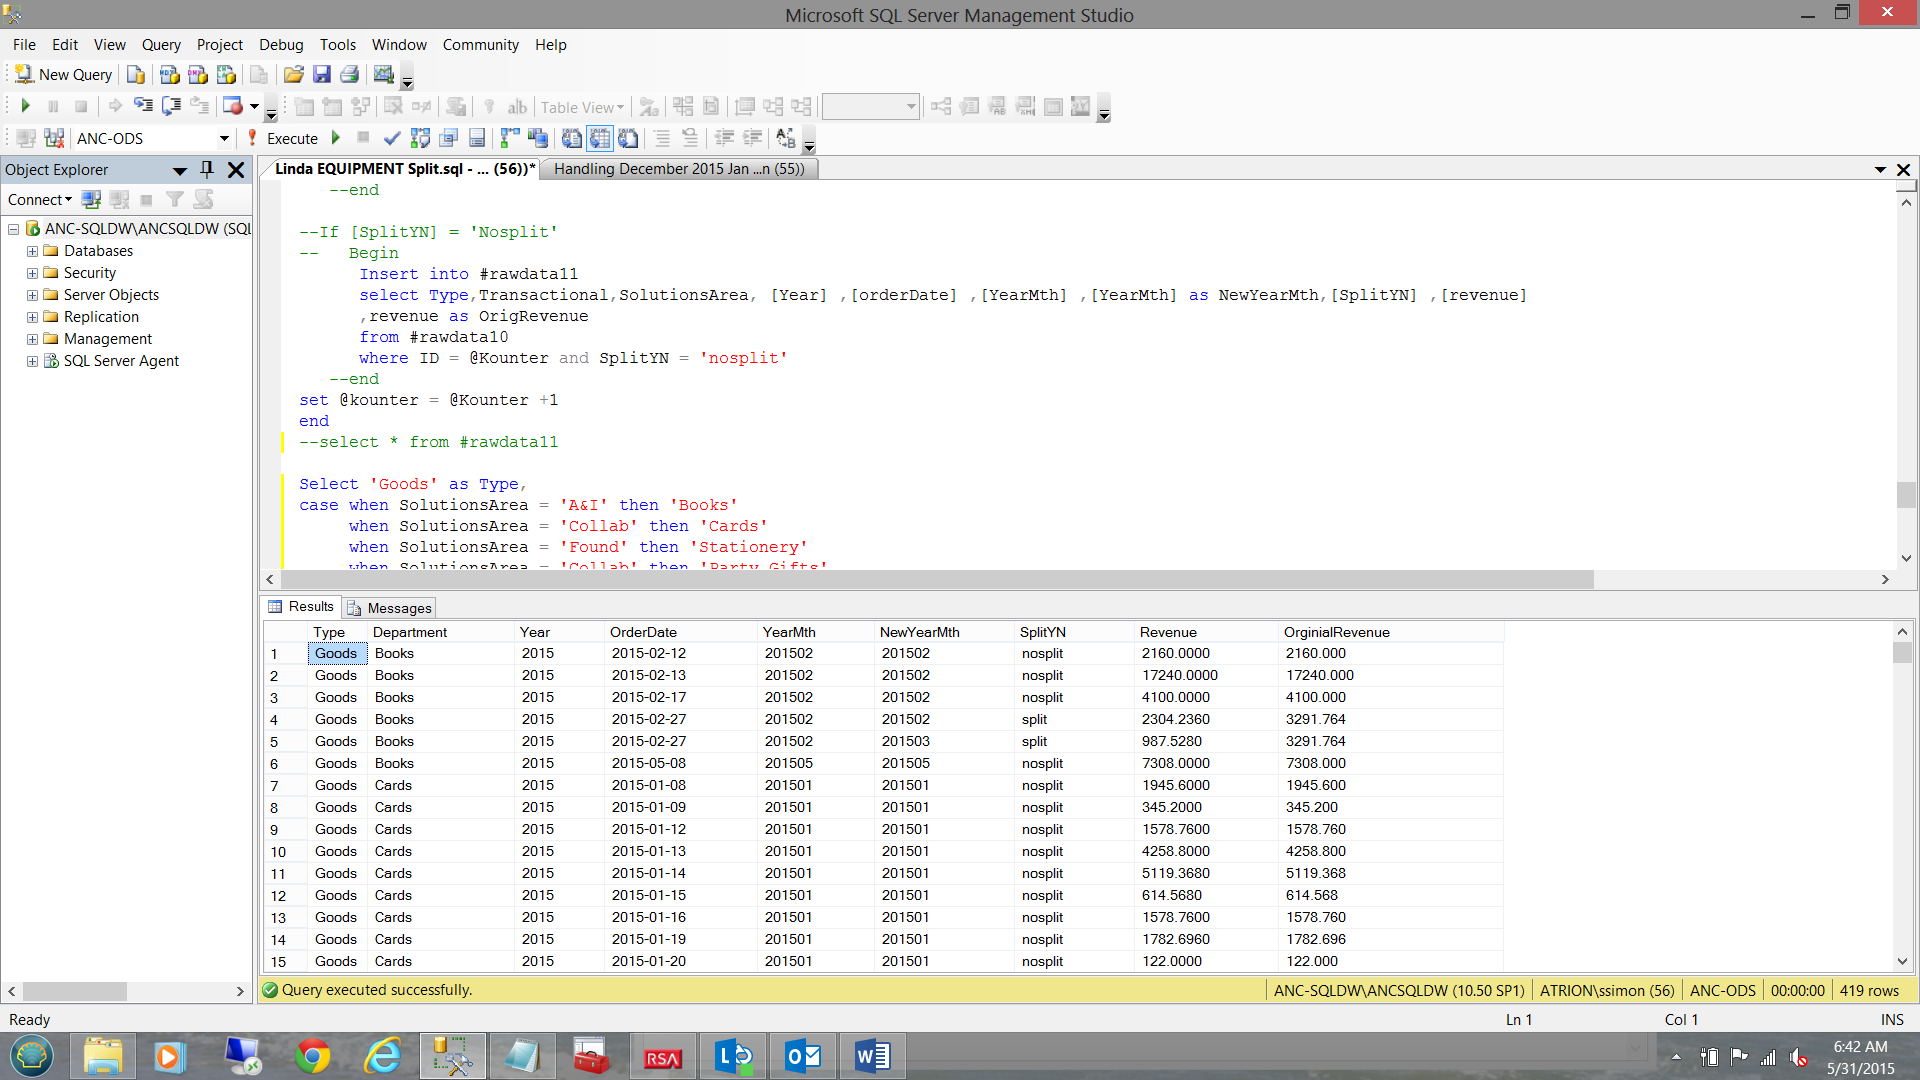
The reader will note that on row 1 (in the screen dump above), the order date was ‘2015-02-12’ which was earlier than Linda’s ‘cut off’ date of the 21st of the month. This said she will project the revenue from this row ‘in full’ for the month of February 2015. Further, because the order date was less than the 21st of the month, the defined field ‘SplitYN’ has been set to ‘nosplit’. The implications of this will become apparent in a few minutes.
Having a look at row 4 (see above) we note that the order date is ‘2015-02-27’ which is, in fact, GREATER than Linda’s 21st cut-off date for recognizing the full revenue for the month of February 2015 and therefore she will only recognize 70% of the ‘Original Revenue’ (see the last column of the screenshot above) in February, and the remaining 30% in March 2015 (See row 5 above). In this case, the defined field ‘SplitYN’ is set to ‘split’.
With a high-level understanding of Linda’s business rules and having seen some of the expected results, let us begin constructing our business solution. The full code listing may be found in Addenda 1.
We begin by declaring a few variables
|
1 2 3 4 5 6 7 8 9 10 11 12 13 14 |
declare @yearIncoming varchar(4) declare @yearr as Varchar(4) declare @Lowyearr as Varchar(4) set @Yearr = datepart(YEAR,Convert(date,Getdate())) set @YearIncoming = @yearr declare @kounter as int Set @Kounter = 1 declare @kount as int Set @Kount = 0 declare @beginFiscal datetime declare @endFiscal datetime declare @ActualBeginfiscal as datetime |
The purpose of these variables will become apparent in a few seconds.
Remembering that Linda wishes to look at the data for the 2015 calendar / fiscal year, then our start date must be December 1, 2014, running through and including December 2015.
At this point, you are probably crying “foul”!! It is important to remember that Linda may have had split data booked in the month of December where she posted 70% in that December and 30% for January 2015. It is this 30% that must be added to our January 2015 projections.
We set our data extraction dates to
|
1 2 3 4 5 |
set @ActualBeginfiscal = convert(varchar(4),@Yearr) + '0101' set @Endfiscal = convert(varchar(4),@Yearr) + '1231' set @Beginfiscal = convert(varchar(4),@Yearr-1) + '1201' |
At this point, an explanation is required. @BeginFiscal will be the start date for our raw data extract. @EndFiscal will be the end date of data extract. The reader is reminded that some data may have been split in December 2014 and we, therefore, must extract this data. We shall rid ourselves of the December 2014 data that was not split plus the split data posted in December 2014, in our final extract (via the predicate logic) as we shall shortly see.
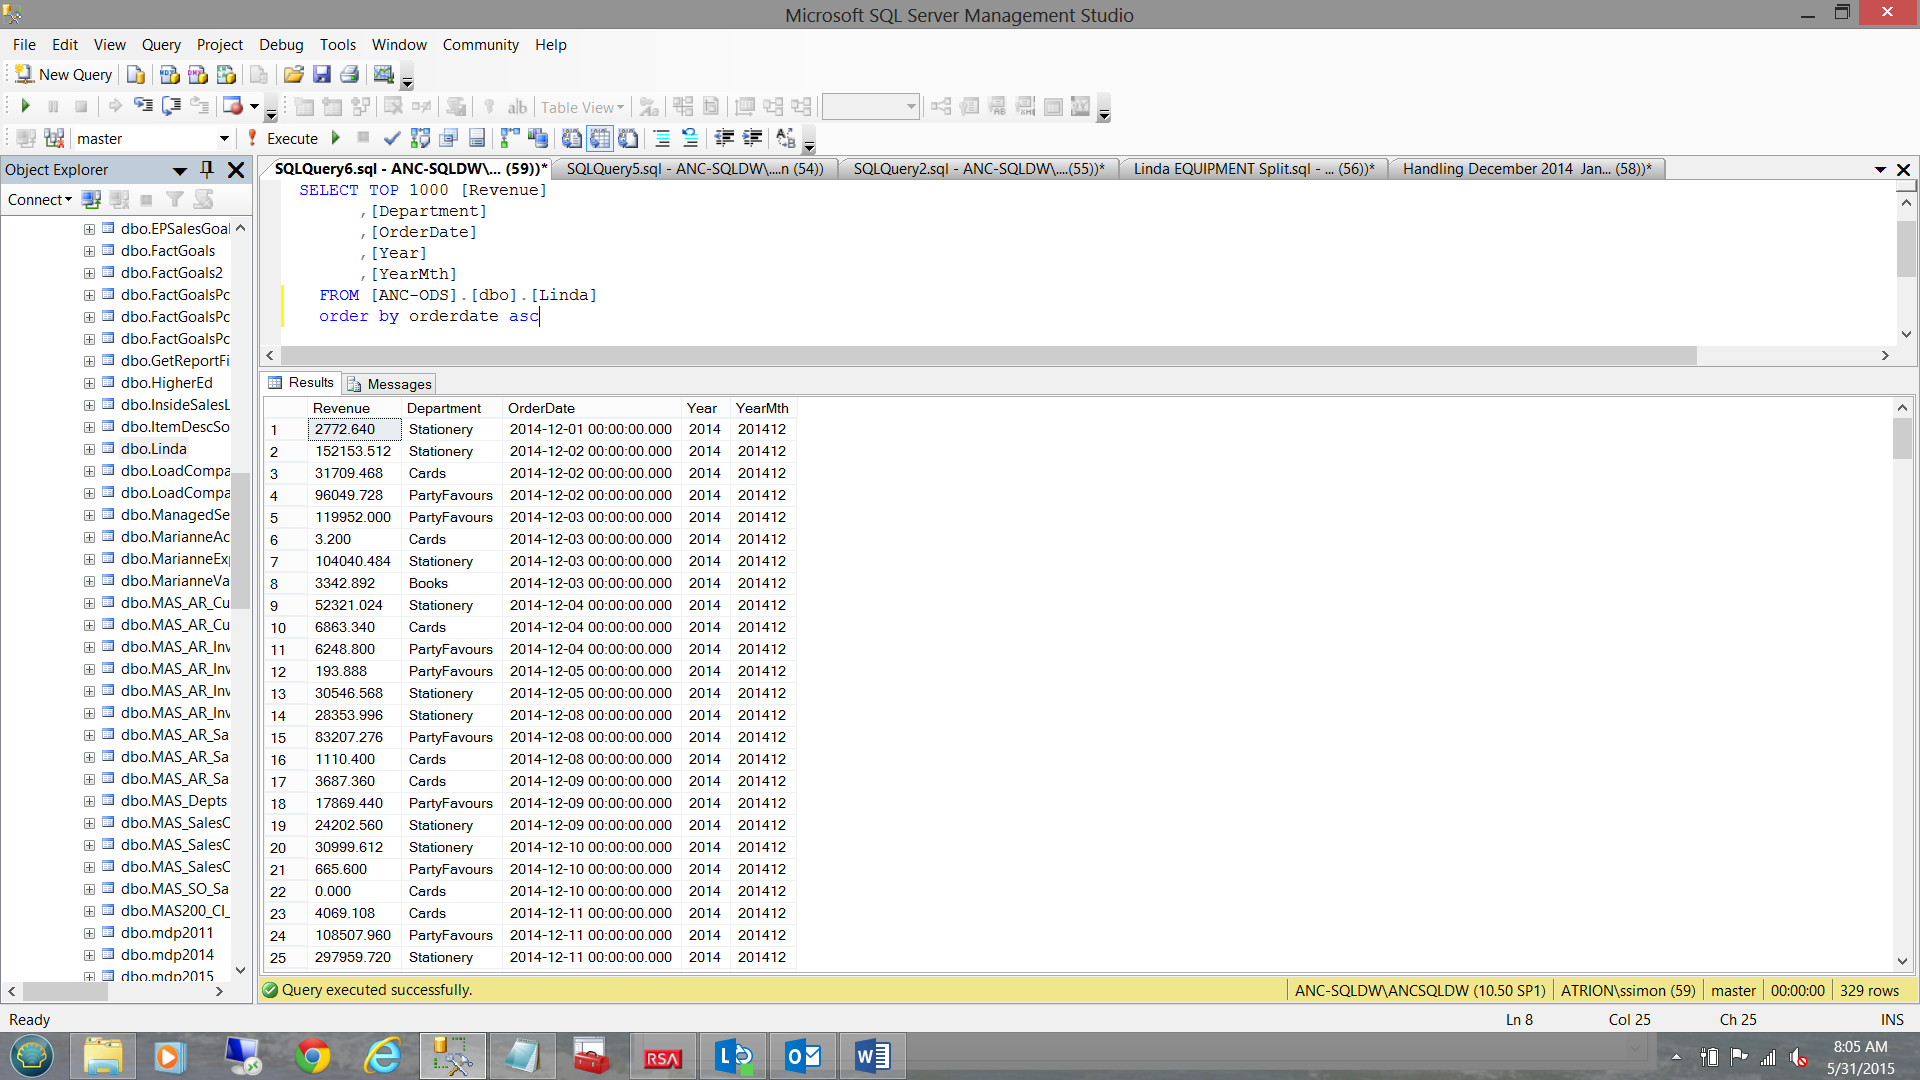
Linda’s raw data (from the orders table) may be seen in the screen shot above.
Creating and processing our query
Our first task is to ascertain which orders must have their revenues split in order to allocate the projections correctly.
|
1 2 3 4 5 6 7 8 9 10 11 |
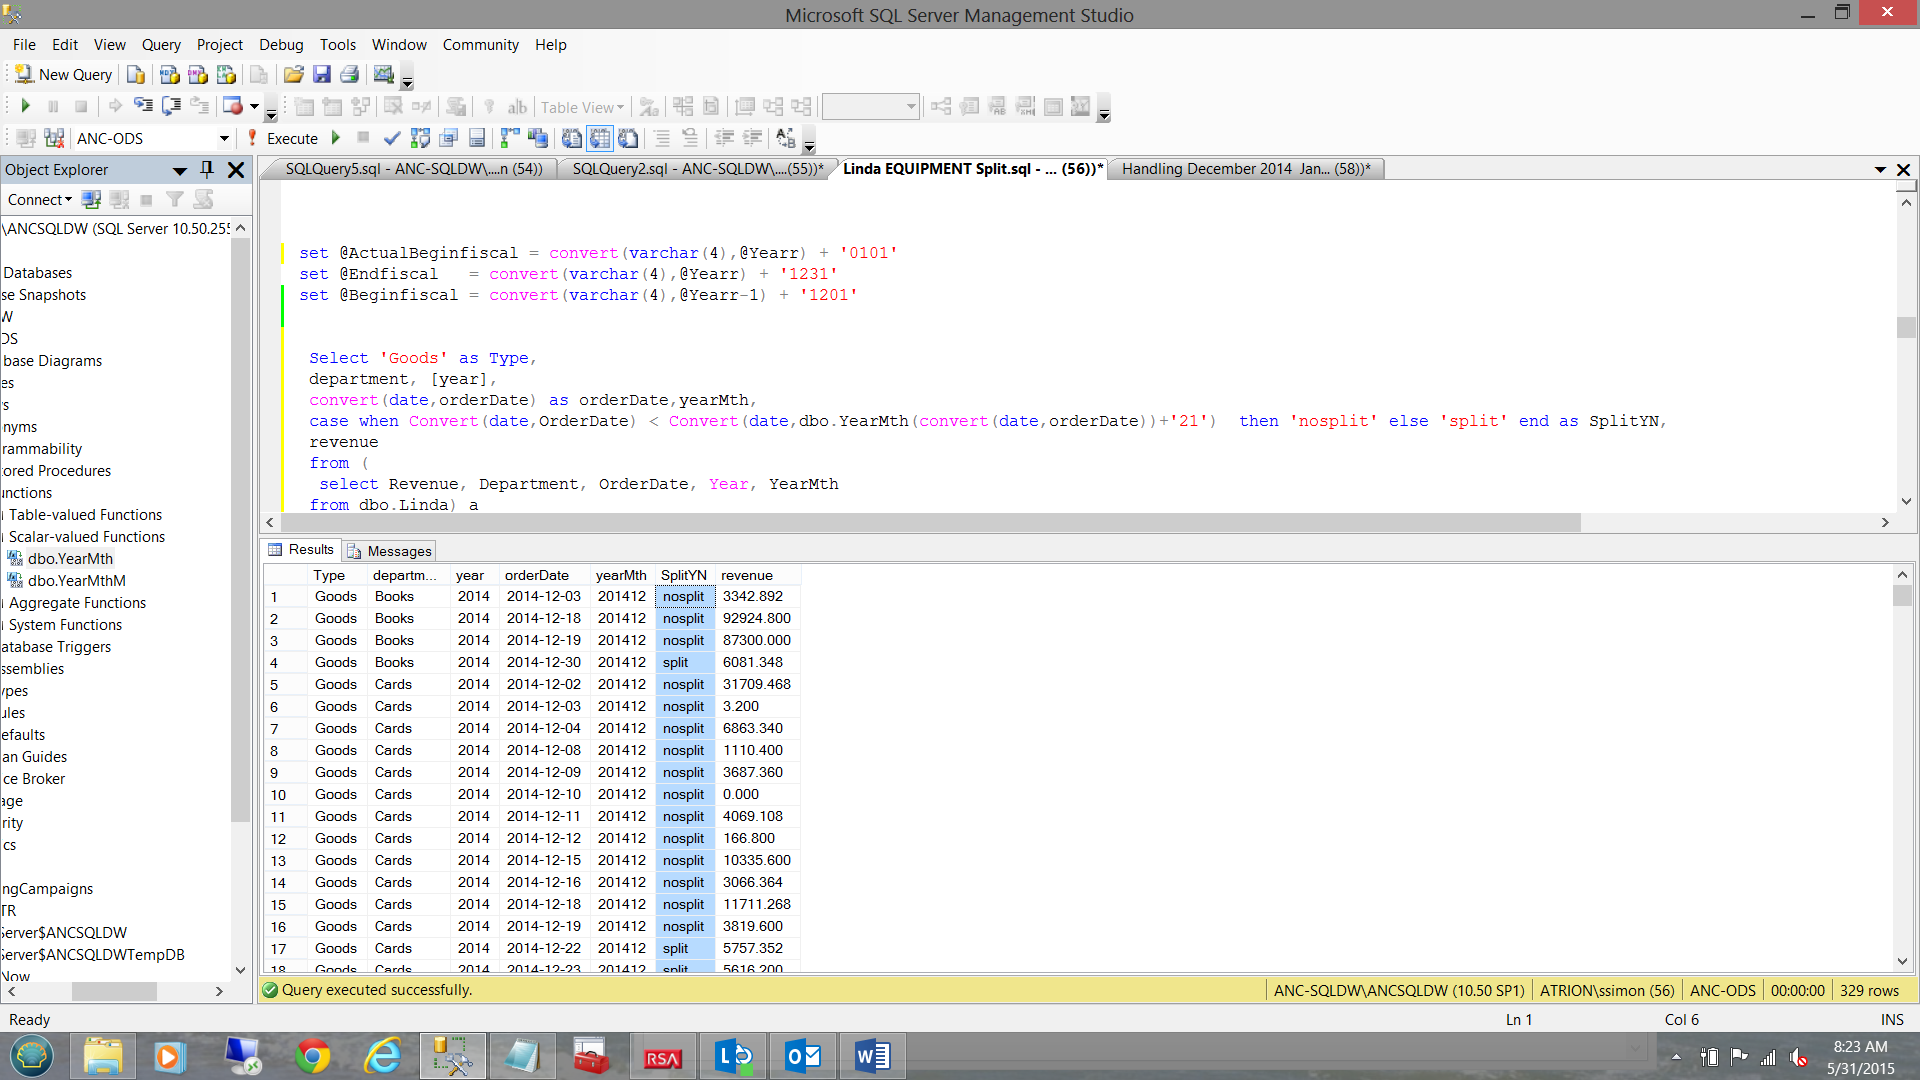
Select 'Goods' as Type, department, [year], convert(date,orderDate) as orderDate,yearMth, case when Convert(date,OrderDate) < Convert(date,dbo.YearMth(convert(date,orderDate))+'21') then 'nosplit' else 'split' end as SplitYN, revenue into #rawdata9 from ( select Revenue, Department, OrderDate, Year, YearMth from dbo.Linda) a Set @Kount = @@Rowcount |
Parts of the code snippet above also require an explanation. In this snippet, we set the value of the field ‘SplitYN’. The business rules state that I must split my revenue if and only if the order date is beyond the 21st of any given month. Many ‘moons’ ago I created a small user-defined function called YearMth. YearMth accepts a datetime field and returns a varchar(6) value containing YYYYMM. The listing for YearMth may be found in Addenda 2.
The results of executing this code snippet may be seen below:
Note also that we have trapped the number of rows that have been extracted through the use of the following code. We shall use the number of rows shortly.
|
1 2 3 |
Set @Kount = @@Rowcount |
The avid reader will have by this time realized that in order for us to achieve our end goal, for any ‘split record’ that we must reduce the revenue of the original month to 70% and add an additional record (for the next calendar month) representing the remaining 30%, thus making up the total revenue over two calendar months as opposed to one. The “nosplit” records are not an issue.
To achieve this we are going to create a temporary table called #rawdata10 which will have an identity as a key field. The reason for this will become apparent in a few seconds.
|
1 2 3 4 5 6 7 8 9 10 11 12 13 14 15 16 17 18 19 20 21 22 |
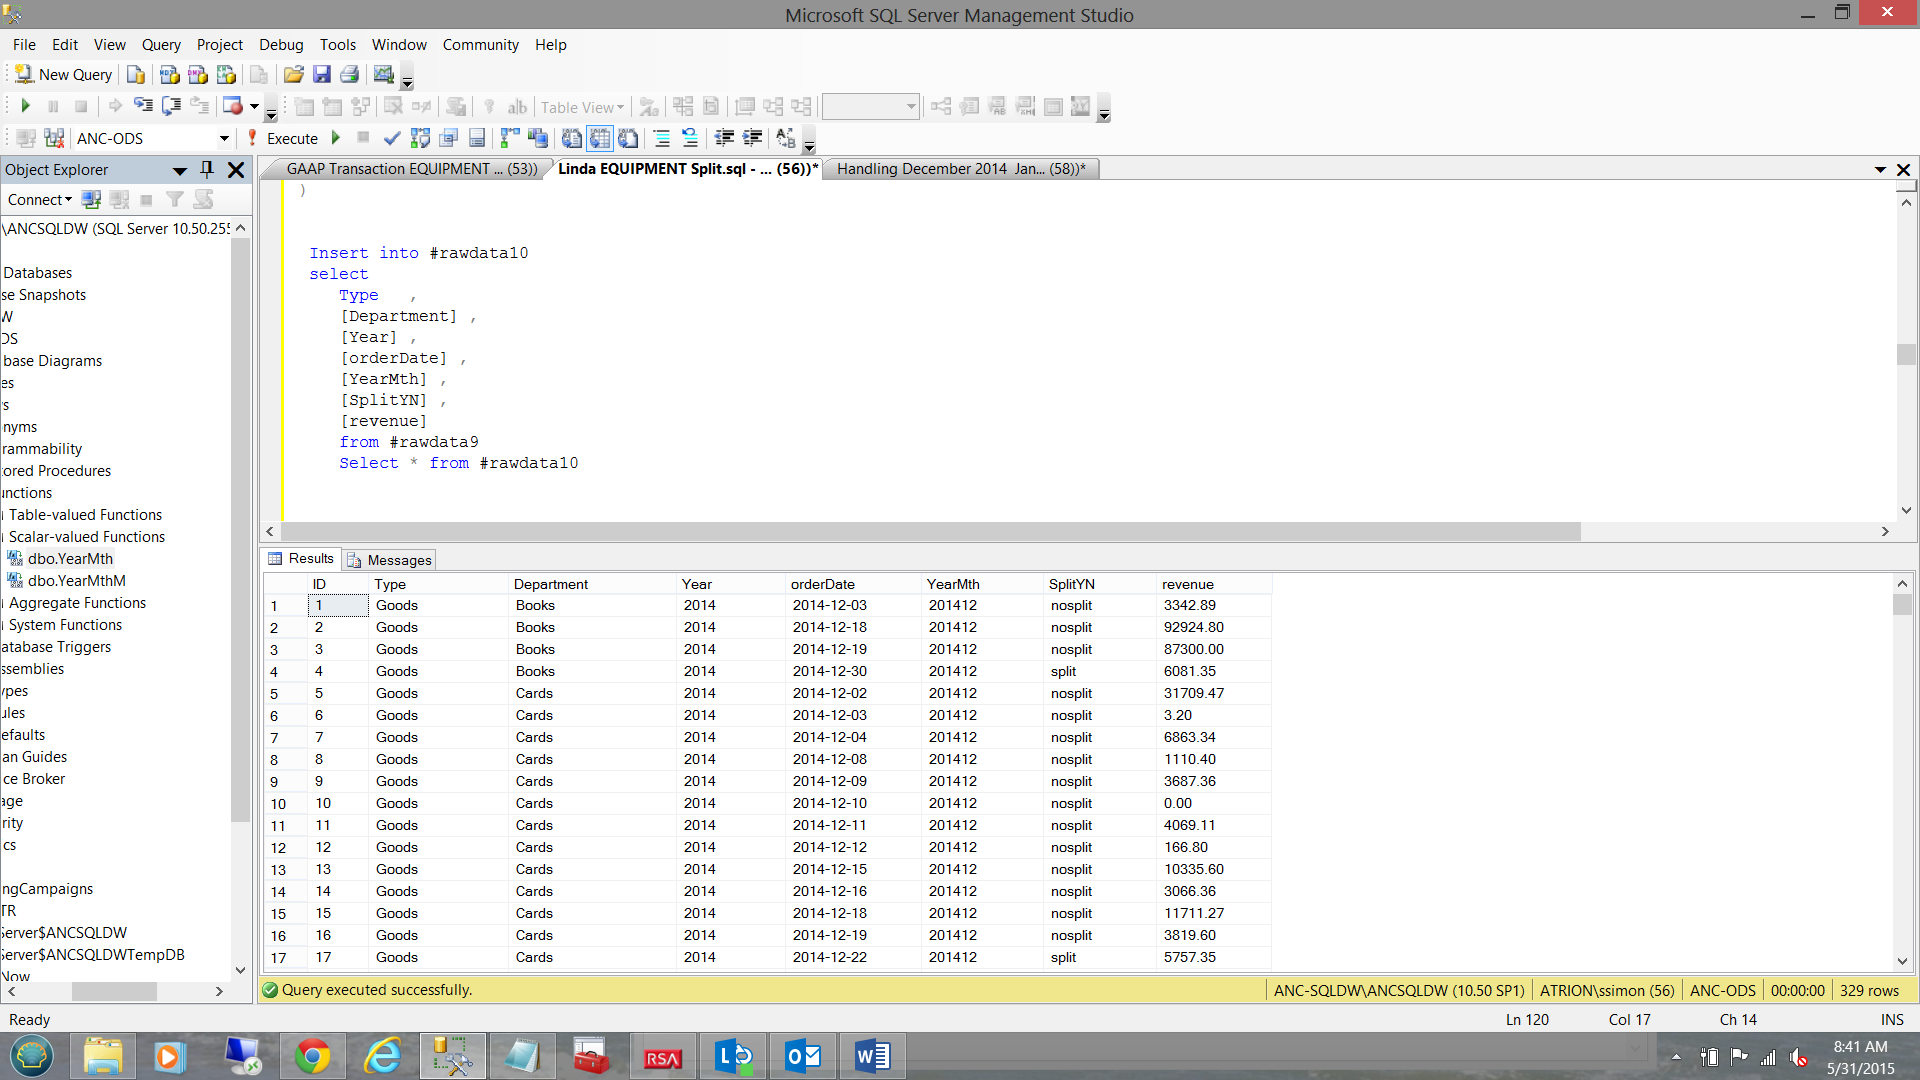
CREATE TABLE #rawdata10( [ID] [int] IDENTITY(1,1) NOT NULL, [Type] [varchar](9) NOT NULL, [Department] [varchar](15) NOT NULL, [Year] int null, [orderDate] [date] NULL, [YearMth] varchar(6) null, [SplitYN] Varchar(7) null, [revenue] [decimal](38, 2) NULL ) Insert into #rawdata10 select Type , [Department] , [Year] , [orderDate] , [YearMth] , [SplitYN] , [revenue] from #rawdata9 |
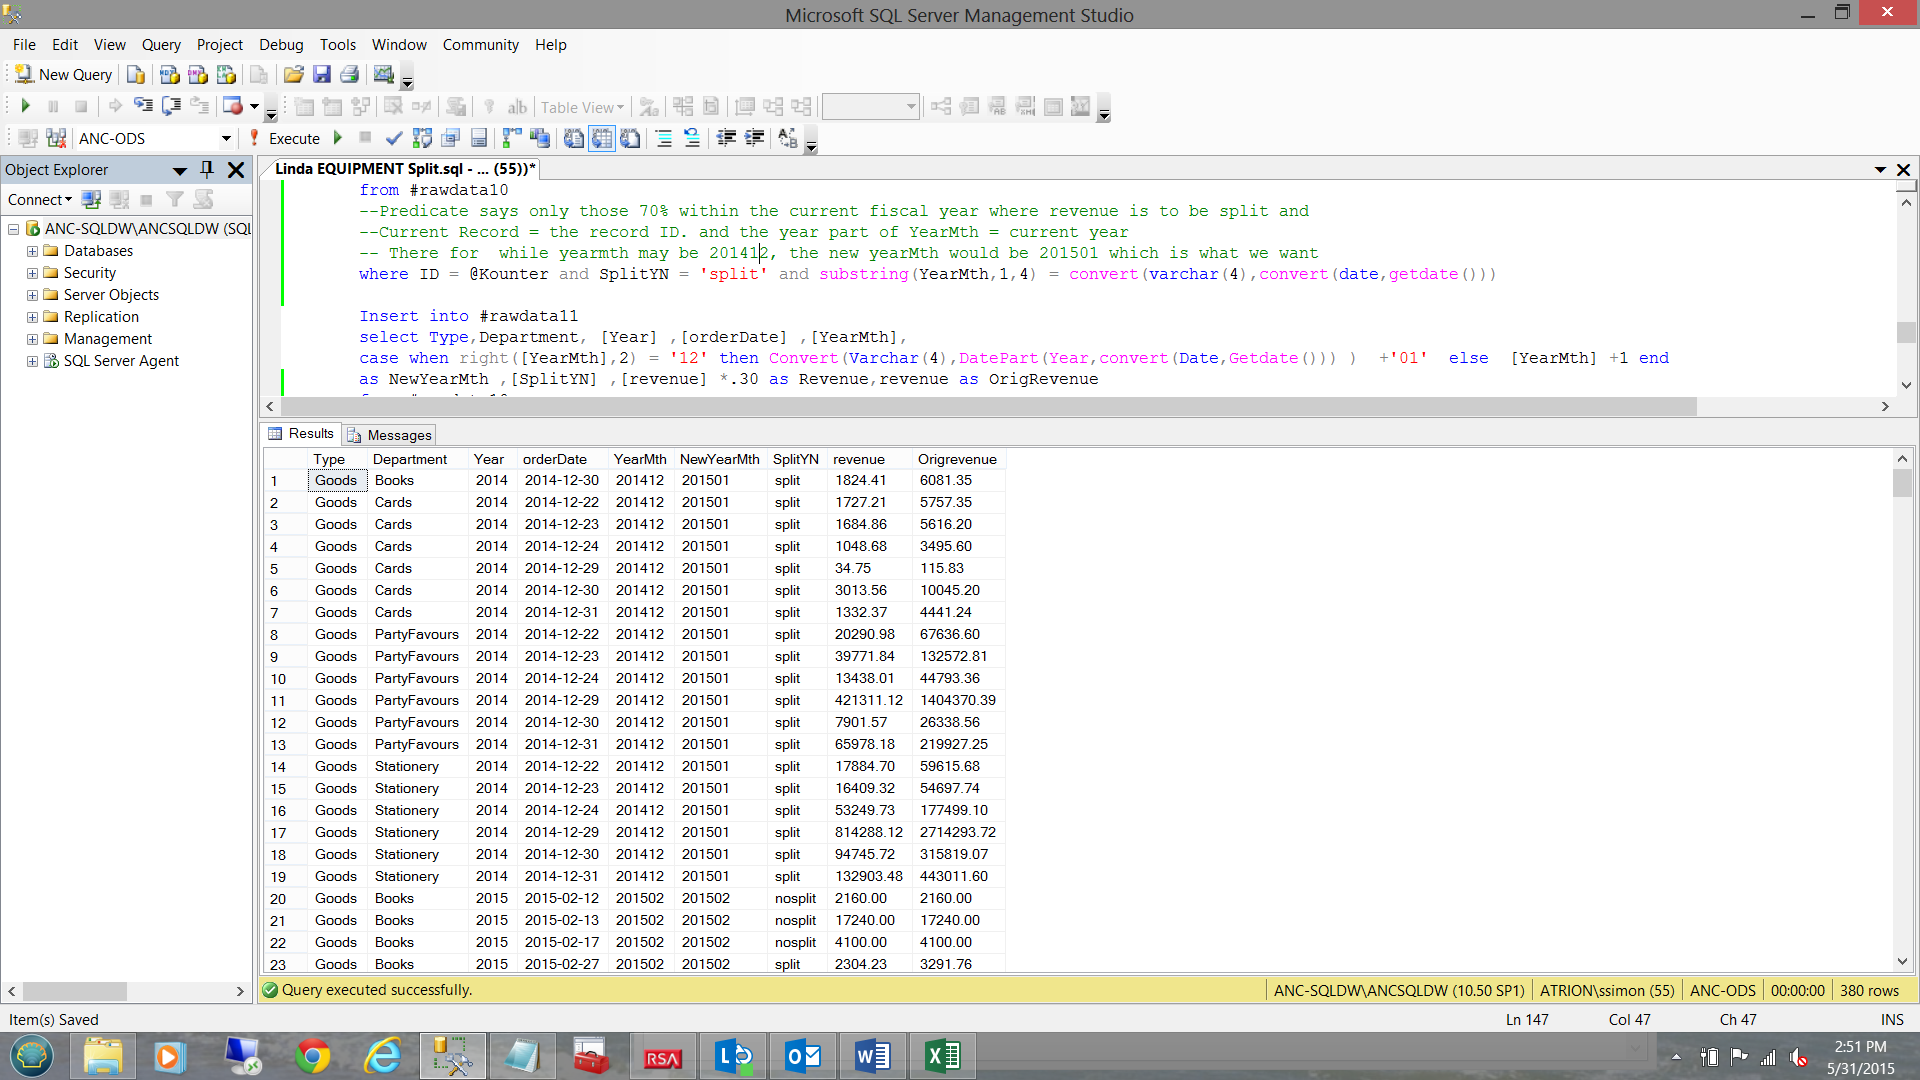
We now insert the records shown in the screen dump above into #rawdata10. The results of doing so may be seen in the screen shot below:
At this point, the astute reader will have noted two important facts pertaining only to records whose revenue must be split over two months
- The revenue for first month must reduced to 70% (as discussed above).
- An additional row must be added for the next month and that row’s revenue must be 30% of the revenue of the previous month, i.e. to make up the full 100% (once again as discussed above).
In order to achieve this goal and have an understanding of the purpose for creating the Identity column “Id”, we are going to parse each record within the #rawdata10 temporary table and should the “SplitYN” field has a value of “Split”, then we going to write that row (with only 70% of the revenue) to #rawData11.
This achieved we shall increment YearMth by one month, only this time we are going to write the same record with the incremented “Yearmth” and 30% of the original data to the same temporary data file, #rawdata11. All non-split rows are written as well to #rawdata11, however once and only once.
In order to achieve all of this, we need to utilize a loop. As we shall be looping and inserting rows into #rawdata11 as we go, the temporary table must have been created PRIOR to entering the loop.
The ‘looping code’ may be seen below:
|
1 2 3 4 5 6 7 8 9 10 11 12 13 14 15 16 17 18 19 20 21 22 23 24 25 26 27 28 29 30 31 32 33 34 |
While @Kounter <= @Kount begin --If [SplitYN] = 'split' -- insert the 70% but not if the year is “last year” and this is the first part. First part was --recognized in December 2014 Insert into #rawdata11 select Type,Department, [Year] ,[orderDate] ,[YearMth] ,[YearMth] as NewYearMth,[SplitYN][SplitYN] ,[revenue] *.70 as Revenue, revenue as OrigRevenue from #rawdata10 --Predicate says only those 70% within the current fiscal year where revenue is to be split and --Current Record = the record ID. where ID = @Kounter and SplitYN = 'split' and substring(YearMth,1,4) = convert(varchar(4),convert(date,getdate())) Insert into #rawdata11 select Type,Department, [Year] ,[orderDate] ,[YearMth], --We cannot have a 201513 for the second part of the split make it 201601 case when right([YearMth],2) = '12' then Convert(Varchar(4),DatePart(Year,convert(Date,Getdate()))+1 ) +'01' else [YearMth] +1 end as NewYearMth ,[SplitYN] ,[revenue] *.30 as Revenue,revenue as OrigRevenue from #rawdata10 --Insert any ‘second parts’ as they will all fall into the calendar / fiscal year --and the current year from getdate() = Year part from YearMTH i.e.2015 < 2016 where (ID = @Kounter) and (SplitYN = 'split') and (substring(YearMth,1,4) <= Convert(Varchar(4),DatePart(Year,convert(Date,Getdate())) ) ) --If [SplitYN] = 'Nosplit' Insert into #rawdata11 select Type,Department, [Year] ,[orderDate] ,[YearMth] ,[YearMth] as NewYearMth,[SplitYN] ,[revenue] ,revenue as OrigRevenue from #rawdata10 --Insert all nosplits with yearMth within the current year where (ID = @Kounter) and (SplitYN = 'nosplit') and (substring(YearMth,1,4) = convert(varchar(4),convert(date,getdate()))) |
We then increment the counter and re-iterate through within the loop
|
1 2 3 |
set @kounter = @Kounter +1 |
For the ‘non-believers’ amongst us, I have taken the liberty of extracting the splits before applying the predicate logic. Please see the screenshot below and then compare it to the result set following that screenshot.
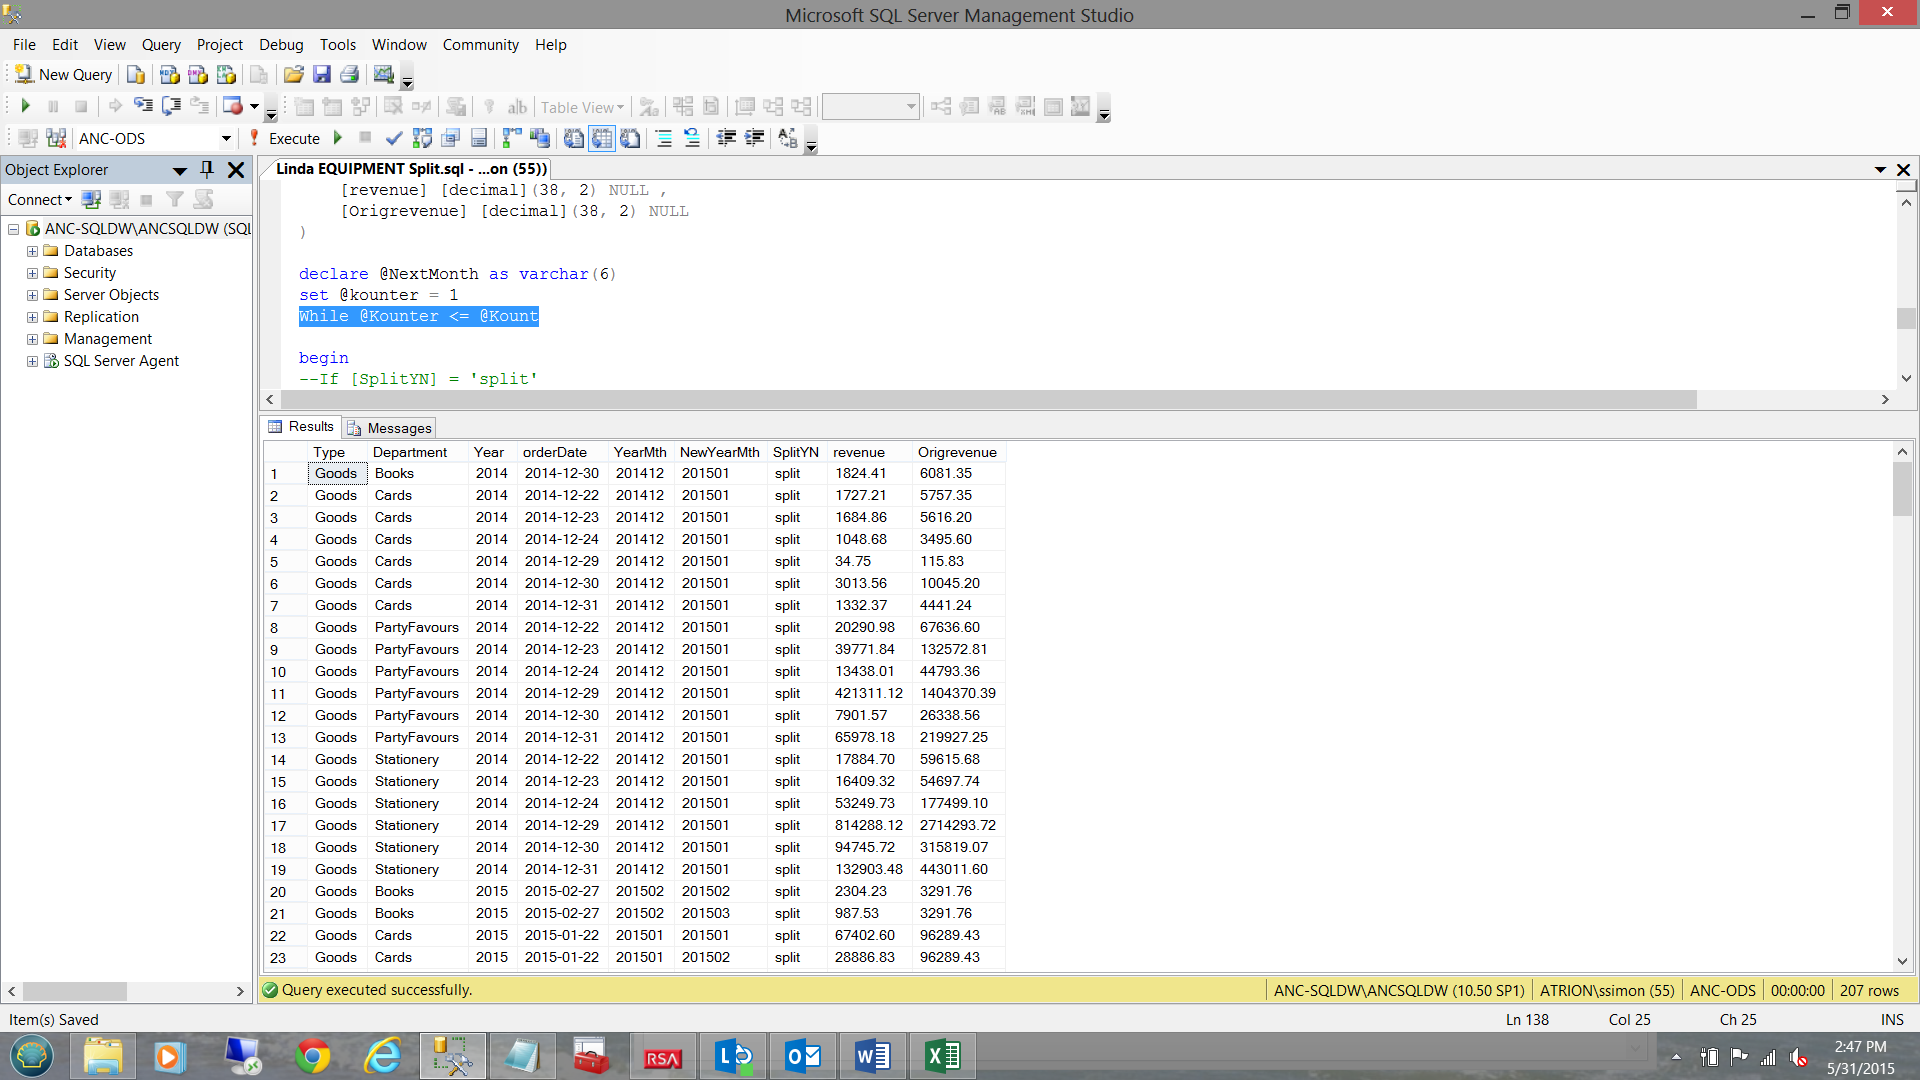
Adding the “nosplits” we find the following for our extract (see below).
It is important to remember that at this stage that the records have not been sorted by YearMth.
Formating the data for a Matrix
Linda has told us that she wishes to see the revenue for each month summarized by the department , by month.
In order to achieve this, we must define a few more variables and set their values accordingly (see below).
|
1 2 3 4 5 6 7 8 9 10 11 12 13 14 15 16 17 18 19 20 21 22 23 24 25 26 |
declare @month01 varchar(6) declare @month02 varchar(6) declare @month03 varchar(6) declare @month04 varchar(6) declare @month05 varchar(6) declare @month06 varchar(6) declare @month07 varchar(6) declare @month08 varchar(6) declare @month09 varchar(6) declare @month10 varchar(6) declare @month11 varchar(6) declare @month12 varchar(6) set @Month01 = Convert(varchar(4),DatePart(Year,Convert(date,getDate()))) + '01' set @Month02 = Convert(varchar(4),DatePart(Year,Convert(date,getDate()))) + '02' set @Month03 = Convert(varchar(4),DatePart(Year,Convert(date,getDate()))) + '03' set @Month04 = Convert(varchar(4),DatePart(Year,Convert(date,getDate()))) + '04' set @Month05 = Convert(varchar(4),DatePart(Year,Convert(date,getDate()))) + '05' set @Month06 = Convert(varchar(4),DatePart(Year,Convert(date,getDate()))) + '06' set @Month07 = Convert(varchar(4),DatePart(Year,Convert(date,getDate()))) + '07' set @Month08 = Convert(varchar(4),DatePart(Year,Convert(date,getDate()))) + '08' set @Month09 = Convert(varchar(4),DatePart(Year,Convert(date,getDate()))) + '09' set @Month10 = Convert(varchar(4),DatePart(Year,Convert(date,getDate()))) + '10' set @Month11 = Convert(varchar(4),DatePart(Year,Convert(date,getDate()))) + '11' set @Month12 = Convert(varchar(4),DatePart(Year,Convert(date,getDate()))) + '12' |
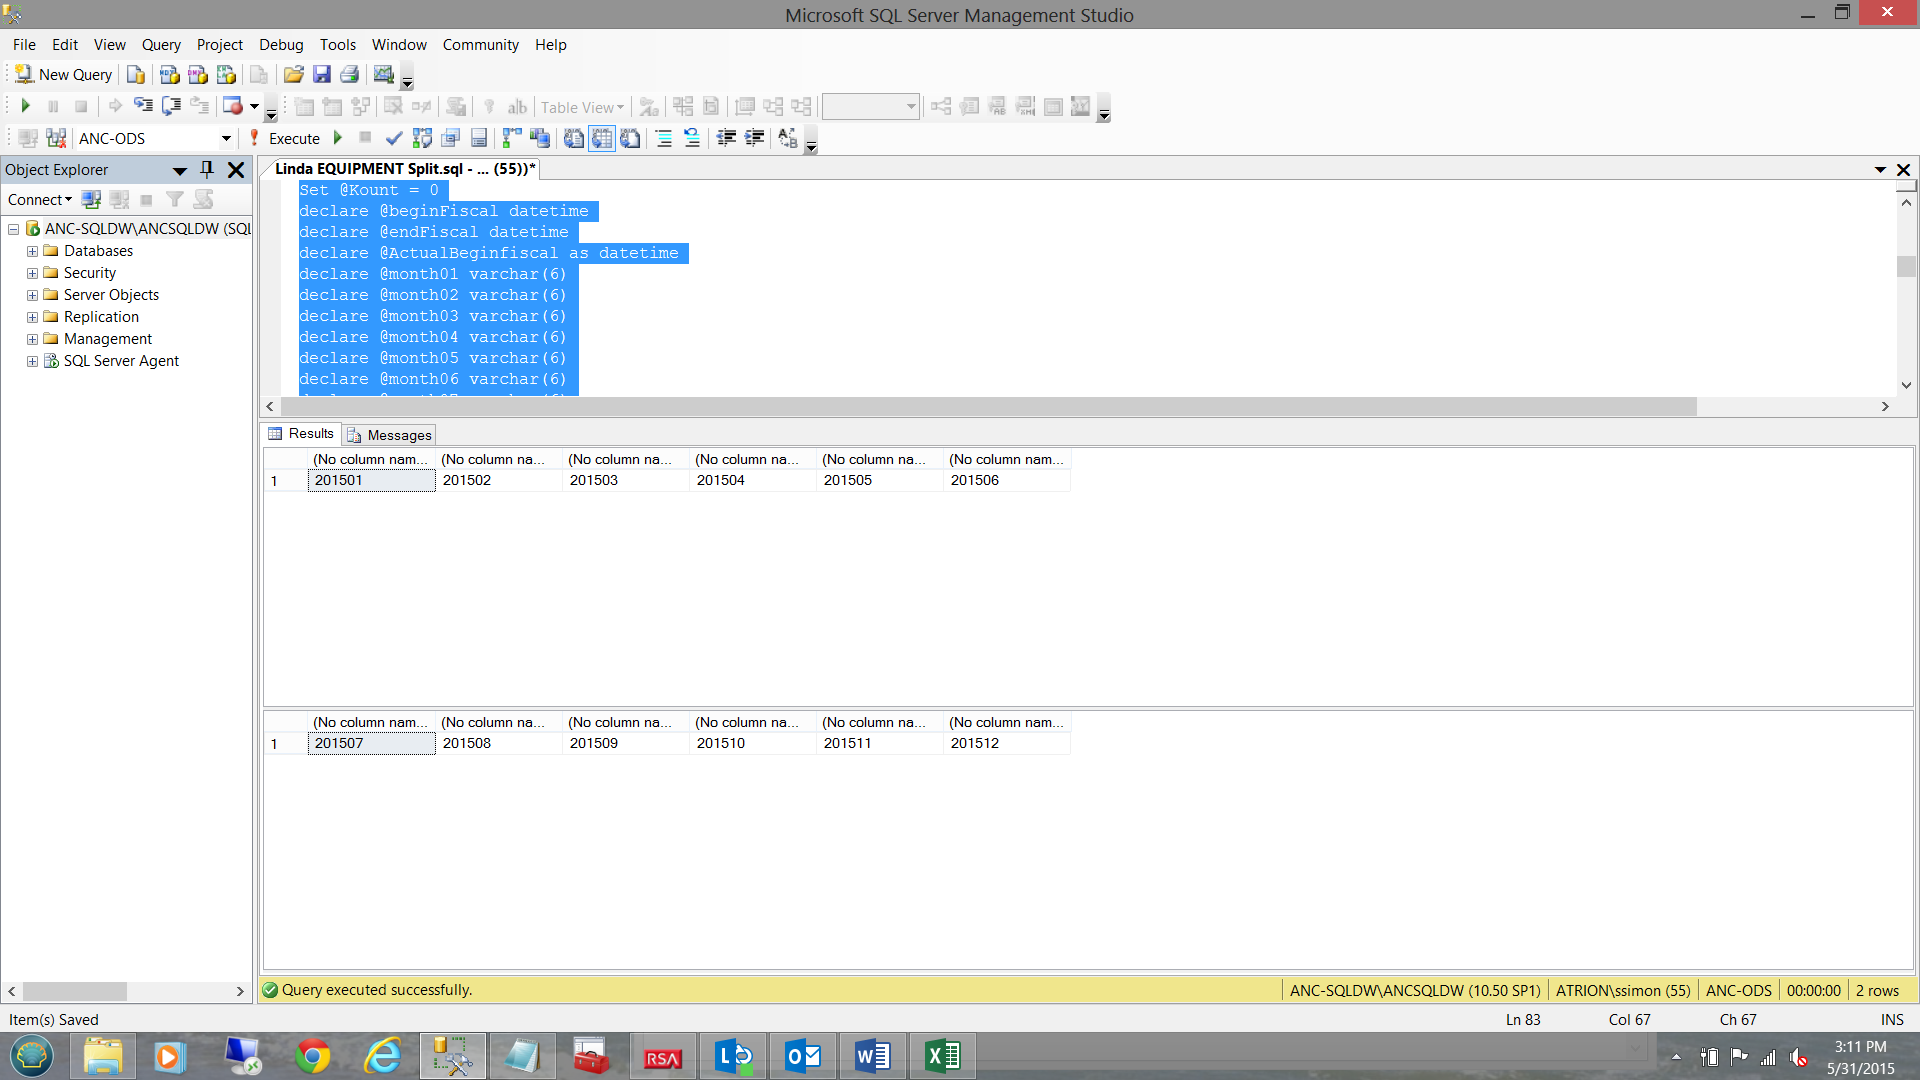
Running the code immediately above produces the following results. The reader will note that the @month variables run from 201501 through 201512.
Adding the final touch to our extract
In order to give Linda the summary that she requires, we are now going to summarize the data by department and by month. This time, however, we shall be utilizing the value of “NewYearMth”. As a recap for split records, there will be two consecutive values for “NewYearMth” and for the non-split records, “NewYearMth” will be the same as “YearMth”.
The code to summarize the data may be seen below:
|
1 2 3 4 5 6 7 8 9 10 11 12 13 14 15 16 17 18 19 20 21 22 23 24 25 26 27 28 29 30 31 32 33 34 |
select Type,transactional,SolutionsArea ,Sum(month01) as Month01 ,Sum(month02) as Month02 ,Sum(month03) as Month03 ,Sum(month04) as Month04 ,Sum(month05) as Month05 ,Sum(month06) as Month06 ,Sum(month07) as Month07 ,Sum(month08) as Month08 ,Sum(month09) as Month09 ,Sum(month10) as Month10 ,Sum(month11) as Month11 ,Sum(month12) as Month12 from ( select Type,transactional,SolutionsArea ,case when NewYearMth = @Month01 then Revenue else 0 end as Month01 ,case when NewYearMth = @Month02 then Revenue else 0 end as Month02 ,case when NewYearMth = @Month03 then Revenue else 0 end as Month03 ,case when NewYearMth = @Month04 then Revenue else 0 end as Month04 ,case when NewYearMth = @Month05 then Revenue else 0 end as Month05 ,case when NewYearMth = @Month06 then Revenue else 0 end as Month06 ,case when NewYearMth = @Month07 then Revenue else 0 end as Month07 ,case when NewYearMth = @Month08 then Revenue else 0 end as Month08 ,case when NewYearMth = @Month09 then Revenue else 0 end as Month09 ,case when NewYearMth = @Month10 then Revenue else 0 end as Month10 ,case when NewYearMth = @Month11 then Revenue else 0 end as Month11 ,case when NewYearMth = @Month12 then Revenue else 0 end as Month12 from #rawdata11)a Group By Type,Department |
The result from executing this code may be seen below:
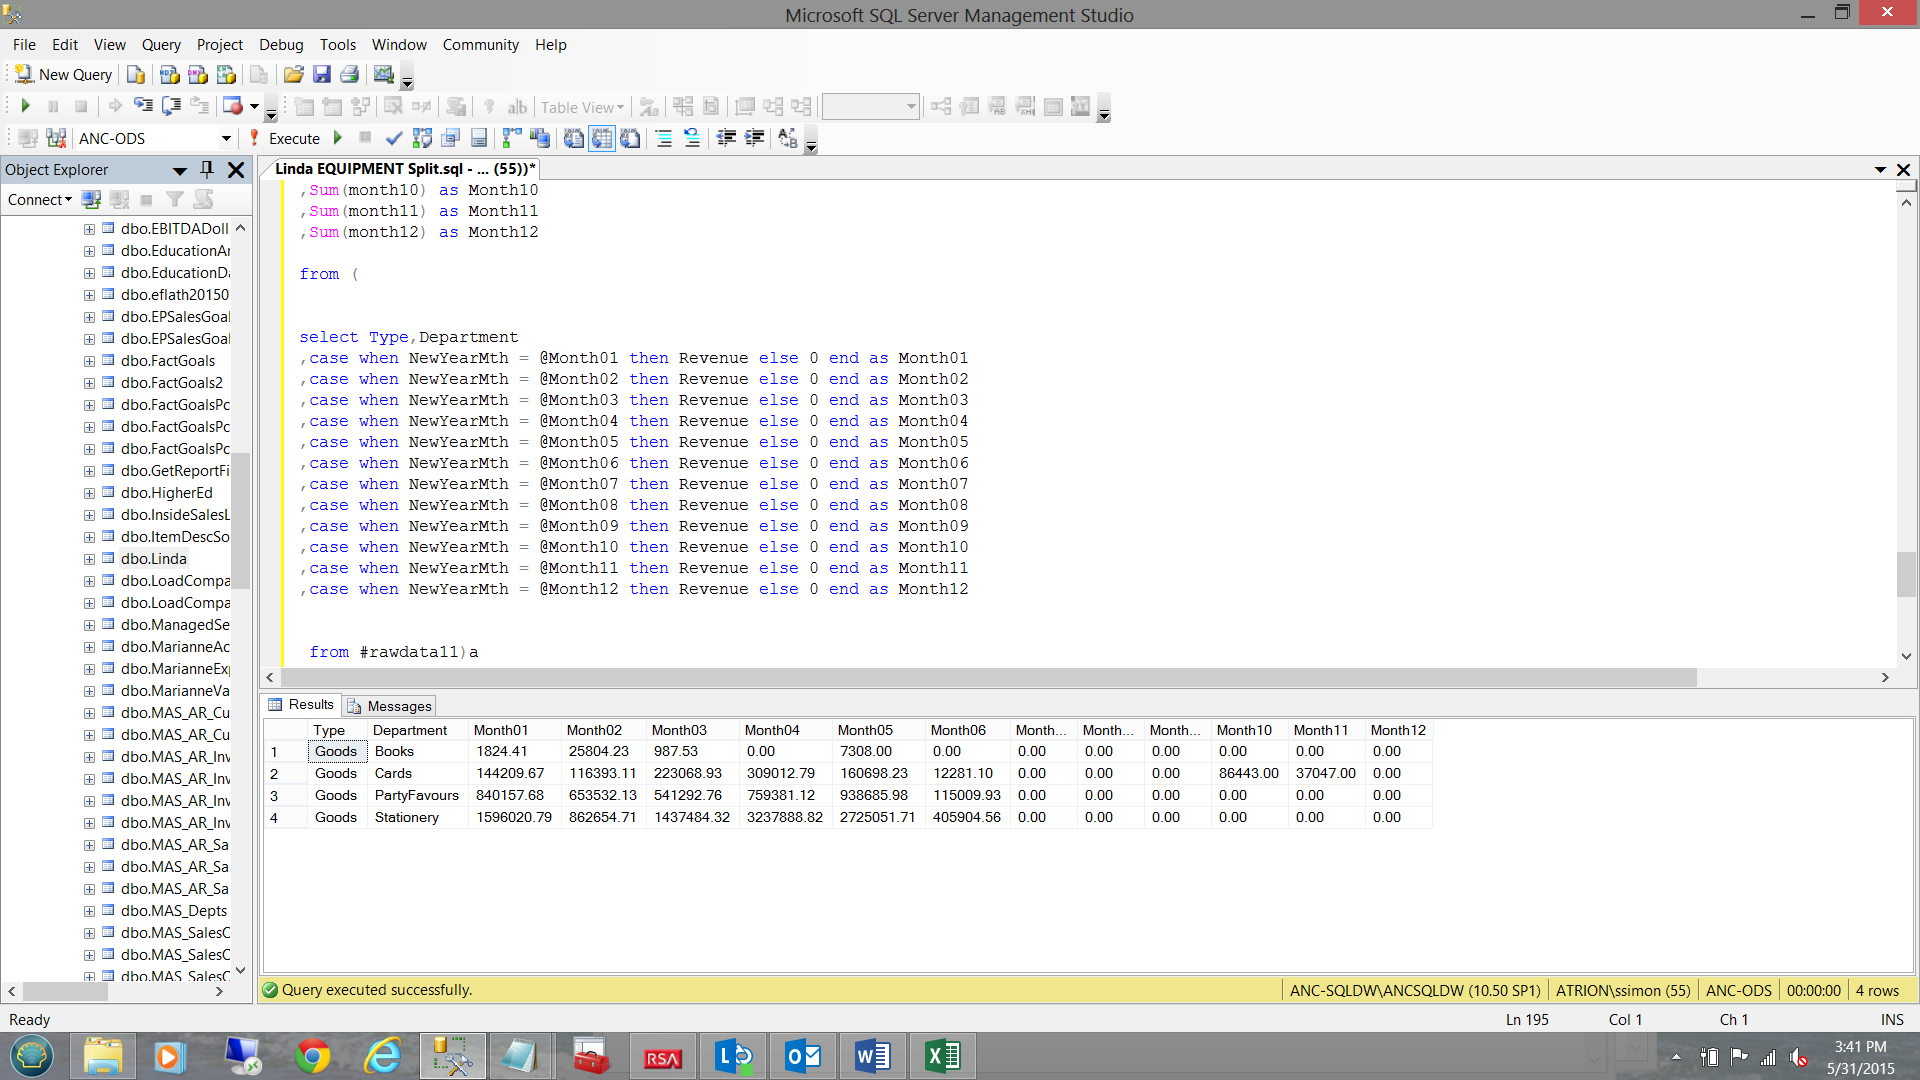
The astute reader will note that not only are there results for the current months of this fiscal year, but there are also results for October and November 2015 (which at the time of writing this article are future dates).
Quo Vadis
Using the SQL Server Reporting techniques that I have described in my previous articles, one may create a stored procedure from this code and utilize it to create a “matrix-based reports”.
Further, with the same code, one can extract the results to be placed in any one of the plethoras of charts available to Reporting Services. This exercise is left up to the reader.
Conclusions
In today’s get together we saw how we could help Linda project her revenue for any fiscal year. We also saw that we could split the projected revenue into two parts if the ‘deal’ was signed too late in the month to recognize the whole amount.
Linda also caters for parties which essentially is a service that she provides and, as such, she has different business rules to projecting this type of revenue. We shall have a look at this in our next get together.
In the interim, happy programming!
Addenda 1
|
1 2 3 4 5 6 7 8 9 10 11 12 13 14 15 16 17 18 19 20 21 22 23 24 25 26 27 28 29 30 31 32 33 34 35 36 37 38 39 40 41 42 43 44 45 46 47 48 49 50 51 52 53 54 55 56 57 58 59 60 61 62 63 64 65 66 67 68 69 70 71 72 73 74 75 76 77 78 79 80 81 82 83 84 85 86 87 88 89 90 91 92 93 94 95 96 97 98 99 100 101 102 103 104 105 106 107 108 109 110 111 112 113 114 115 116 117 118 119 120 121 122 123 124 125 126 127 128 129 130 131 132 133 134 135 136 137 138 139 140 141 142 143 144 145 146 147 148 149 150 151 152 153 154 155 156 157 158 159 160 161 162 163 164 165 166 167 168 169 170 171 172 173 174 175 176 177 178 179 180 181 182 183 184 185 186 187 188 189 190 191 192 193 194 195 196 197 198 199 200 |
USE [LINDA] GO SET ANSI_NULLS ON GO SET QUOTED_IDENTIFIER ON GO IF OBJECT_ID(N'tempdb..#rawdata10') IS NOT NULL BEGIN DROP TABLE #rawdata10 END IF OBJECT_ID(N'tempdb..#rawdata11') IS NOT NULL BEGIN DROP TABLE #rawdata11 END IF OBJECT_ID(N'tempdb..#rawdata9') IS NOT NULL BEGIN DROP TABLE #rawdata9 END IF OBJECT_ID(N'tempdb..#rawdata5') IS NOT NULL BEGIN DROP TABLE #rawdata5 END GO --Declare variables and set start and end dates --CREATE procedure [dbo].[LindasBookingsRecognition] --as declare @yearIncoming varchar(4) declare @decider as int declare @yearr as Varchar(4) declare @Lowyearr as Varchar(4) set @Yearr = datepart(YEAR,Convert(date,Getdate())) set @YearIncoming = @yearr declare @username varchar(50) set @username = '_All' declare @period varchar(20) set @Period = 'Month' declare @kounter as int Set @Kounter = 1 declare @kount as int Set @Kount = 0 declare @beginFiscal datetime declare @endFiscal datetime declare @ActualBeginfiscal as datetime declare @month01 varchar(6) declare @month02 varchar(6) declare @month03 varchar(6) declare @month04 varchar(6) declare @month05 varchar(6) declare @month06 varchar(6) declare @month07 varchar(6) declare @month08 varchar(6) declare @month09 varchar(6) declare @month10 varchar(6) declare @month11 varchar(6) declare @month12 varchar(6) set @Month01 = Convert(varchar(4),DatePart(Year,Convert(date,getDate()))) + '01' set @Month02 = Convert(varchar(4),DatePart(Year,Convert(date,getDate()))) + '02' set @Month03 = Convert(varchar(4),DatePart(Year,Convert(date,getDate()))) + '03' set @Month04 = Convert(varchar(4),DatePart(Year,Convert(date,getDate()))) + '04' set @Month05 = Convert(varchar(4),DatePart(Year,Convert(date,getDate()))) + '05' set @Month06 = Convert(varchar(4),DatePart(Year,Convert(date,getDate()))) + '06' set @Month07 = Convert(varchar(4),DatePart(Year,Convert(date,getDate()))) + '07' set @Month08 = Convert(varchar(4),DatePart(Year,Convert(date,getDate()))) + '08' set @Month09 = Convert(varchar(4),DatePart(Year,Convert(date,getDate()))) + '09' set @Month10 = Convert(varchar(4),DatePart(Year,Convert(date,getDate()))) + '10' set @Month11 = Convert(varchar(4),DatePart(Year,Convert(date,getDate()))) + '11' set @Month12 = Convert(varchar(4),DatePart(Year,Convert(date,getDate()))) + '12' --select @month01,@Month02, @month03, @Month04 , @Month05 , @Month06 --select @month07,@Month08, @month09, @Month10 , @Month11 , @Month12 set @ActualBeginfiscal = convert(varchar(4),@Yearr) + '0101' set @Endfiscal = convert(varchar(4),@Yearr) + '1231' set @Beginfiscal = convert(varchar(4),@Yearr-1) + '1201' Select 'Goods' as Type, department, [year], convert(date,orderDate) as orderDate,yearMth, case when Convert(date,OrderDate) < Convert(date,dbo.YearMth(convert(date,orderDate))+'21') then 'nosplit' else 'split' end as SplitYN, revenue into #rawdata9 from ( select Revenue, Department, OrderDate, Year, YearMth from dbo.Linda) a Set @Kount = @@Rowcount CREATE TABLE #rawdata10( [ID] [int] IDENTITY(1,1) NOT NULL, [Type] [varchar](9) NOT NULL, [Department] [varchar](15) NOT NULL, [Year] int null, [orderDate] [date] NULL, [YearMth] varchar(6) null, [SplitYN] Varchar(7) null, [revenue] [decimal](38, 2) NULL ) --select * from #rawdata10 Insert into #rawdata10 select Type , [Department] , [Year] , [orderDate] , [YearMth] , [SplitYN] , [revenue] from #rawdata9 CREATE TABLE #rawdata11( [Type] [varchar](9) NOT NULL, [Department] [varchar](15) NOT NULL, [Year] int null, [orderDate] [date] NULL, [YearMth] varchar(6) null, [NewYearMth] varchar(6) null, [SplitYN] Varchar(7) null, [revenue] [decimal](38, 2) NULL , [Origrevenue] [decimal](38, 2) NULL ) declare @NextMonth as varchar(6) set @kounter = 1 While @Kounter <= @Kount begin --If [SplitYN] = 'split' Insert into #rawdata11 select Type,Department, [Year] ,[orderDate] ,[YearMth] ,[YearMth] as NewYearMth,[SplitYN][SplitYN] ,[revenue] *.70 as Revenue, revenue as OrigRevenue from #rawdata10 --Predicate says only those 70% within the current fiscal year where revenue is to be split and --Current Record = the record ID. and the year part of YearMth = current year -- There for while yearmth may be 201412, the new yearMth would be 201501 which is what we want where (ID = @Kounter) and (SplitYN = 'split') and (substring(YearMth,1,4) = convert(varchar(4),convert(date,getdate()))) Insert into #rawdata11 select Type,Department, [Year] ,[orderDate] ,[YearMth], case when right([YearMth],2) = '12' then Convert(Varchar(4),DatePart(Year,convert(Date,Getdate())) ) +'01' else [YearMth] +1 end as NewYearMth ,[SplitYN] ,[revenue] *.30 as Revenue,revenue as OrigRevenue from #rawdata10 --Insert any ‘second parts’ as they will all fall into the calendar / fiscal year --and the current year from getdate() = Year part from YearMTH i.e.2015 < 2016 where (ID = @Kounter) and (SplitYN = 'split') and (substring(YearMth,1,4) <= Convert(Varchar(4),DatePart(Year,convert(Date,Getdate())) ) ) --If [SplitYN] = 'Nosplit' Insert into #rawdata11 select Type,Department, [Year] ,[orderDate] ,[YearMth] ,[YearMth] as NewYearMth,[SplitYN] ,[revenue] ,revenue as OrigRevenue from #rawdata10 where (ID = @Kounter) and (SplitYN = 'nosplit') and (substring(YearMth,1,4) = convert(varchar(4),convert(date,getdate()))) set @kounter = @Kounter +1 end --select * from #rawdata11 select Type,Department ,Sum(month01) as Month01 ,Sum(month02) as Month02 ,Sum(month03) as Month03 ,Sum(month04) as Month04 ,Sum(month05) as Month05 ,Sum(month06) as Month06 ,Sum(month07) as Month07 ,Sum(month08) as Month08 ,Sum(month09) as Month09 ,Sum(month10) as Month10 ,Sum(month11) as Month11 ,Sum(month12) as Month12 from ( select Type,Department ,case when NewYearMth = @Month01 then Revenue else 0 end as Month01 ,case when NewYearMth = @Month02 then Revenue else 0 end as Month02 ,case when NewYearMth = @Month03 then Revenue else 0 end as Month03 ,case when NewYearMth = @Month04 then Revenue else 0 end as Month04 ,case when NewYearMth = @Month05 then Revenue else 0 end as Month05 ,case when NewYearMth = @Month06 then Revenue else 0 end as Month06 ,case when NewYearMth = @Month07 then Revenue else 0 end as Month07 ,case when NewYearMth = @Month08 then Revenue else 0 end as Month08 ,case when NewYearMth = @Month09 then Revenue else 0 end as Month09 ,case when NewYearMth = @Month10 then Revenue else 0 end as Month10 ,case when NewYearMth = @Month11 then Revenue else 0 end as Month11 ,case when NewYearMth = @Month12 then Revenue else 0 end as Month12 from #rawdata11)a Group By Type,Department |
Addenda2
|
1 2 3 4 5 6 7 8 9 10 11 12 13 14 15 16 17 18 19 20 21 22 |
SET ANSI_NULLS ON GO SET QUOTED_IDENTIFIER ON GO CREATE FUNCTION [dbo].[YearMth] ( @Datee date ) RETURNS Varchar(6) AS BEGIN declare @Return varchar(6) select @Return = convert(varchar(4),DatePart(Year,@Datee)) + (case when datepart(Month,@Datee) < 10 then '0' + convert(varchar(2),datepart(Month,@Datee)) else Convert(varchar(2),datepart(Month,@Datee)) end) RETURN(@Return) END GO |
Steve has presented papers at 8 PASS Summits and one at PASS Europe 2009 and 2010. He has recently presented a Master Data Services presentation at the PASS Amsterdam Rally.
Steve has presented 5 papers at the Information Builders' Summits. He is a PASS regional mentor.
View all posts by Steve Simon
- Reporting in SQL Server – Using calculated Expressions within reports - December 19, 2016
- How to use Expressions within SQL Server Reporting Services to create efficient reports - December 9, 2016
- How to use SQL Server Data Quality Services to ensure the correct aggregation of data - November 9, 2016