

In this article, we are going to learn how to use Power BI Desktop Q&A functionality to enable users to ask the question from the data set and easily get the results without any configuration or write complex codes.
In today’s digital world, we are moving towards more interactions with the data with natural language. You might be familiar with the Amazon’s Alexa Microsoft Cortana or the Apple’s Siri. Natural language helps the users to communicate with our data set in a friendly way. If we can implement the interactions using natural language in the business intelligence system, it would be convenient to deal with complex data. We do not need to write complex queries, create visualization every time as per the user’s requirements.
In Power BI Desktop, we can talk with the data using the Q & A feature. We can ask questions and get the data, visualizations with this natural language. When we ask questions using the Q & A functionality in natural language, Power BI creates the data or visualizations based on the keywords. It generates the visualization as per the keywords. This is a very quick process and we get the result very fast. We should create the data set and its columns with functional meaning. It would be easy for the users to understand the data set and ask the questions effectively. We need to understand the difference between the search engine and the Q&A functionality. In a search engine, we search data across the web but Q& A gives results from the data set used in the Power BI Desktop report.
In Power BI, Q&A currently works only if the data model is having the imported data. If we are using the live connections to SQL Server Analysis Service (Cube) or direct query to data, we cannot use the Q&A.
Power BI currently supports asking natural language questions in English. Let us explore this functionality in a practical way.
In this example, we will use the sample dashboard available at the Microsoft docs. We will use Q& A functionality in the Power BI Desktop, therefore, download the .pbix file from the link mentioned above.
Let me give a brief introduction to the sample data used in the report. This sample contains a sales and marketing dashboard for the manufacturing company. It contains multiple dashboards to visualize the company market share, sentiments, and Growth Opportunities.
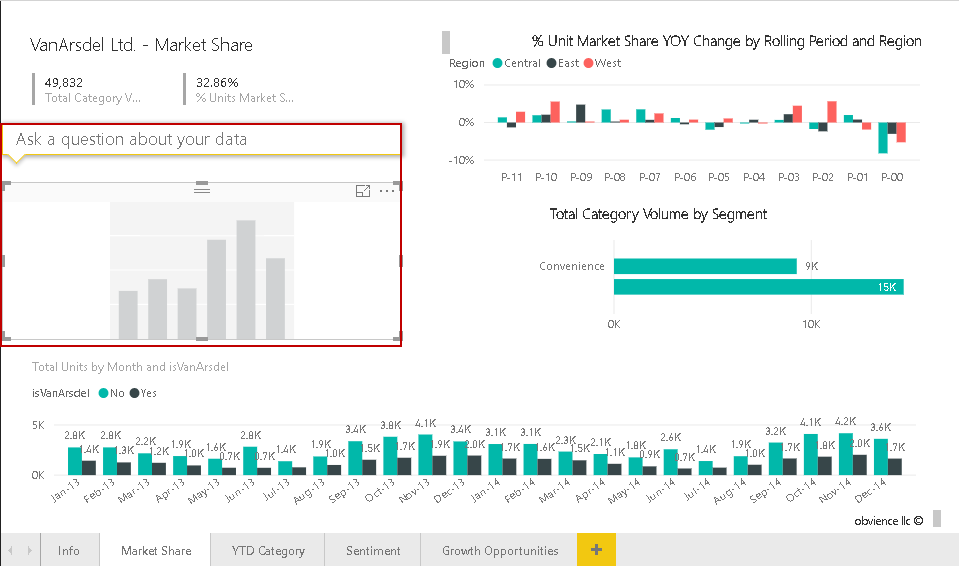
Below is the screenshot from the visual.
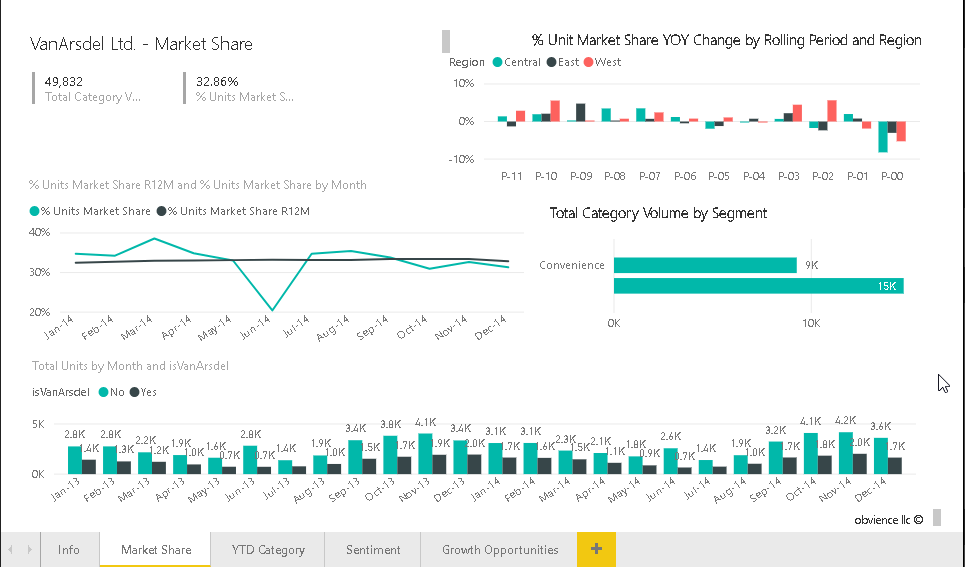
In this report, you can see we have the following charts
- Market share
- % Unit Market Share YOY Change by Rolling Period and Region
- % Unit Market share R12M and % units Market Share by Month
- Total category Volume by segment
- Total Units by Month
In the Power BI Desktop menu bar, you can see the icon ‘Ask a Question’.
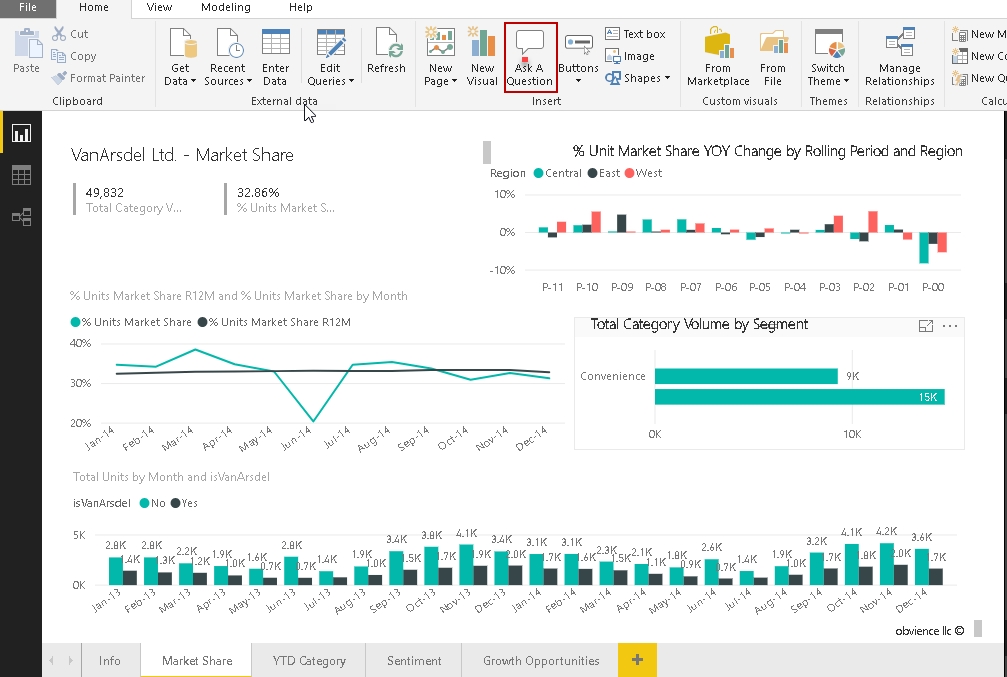
Click on this icon and it launches the Q&A pop up box in the report.
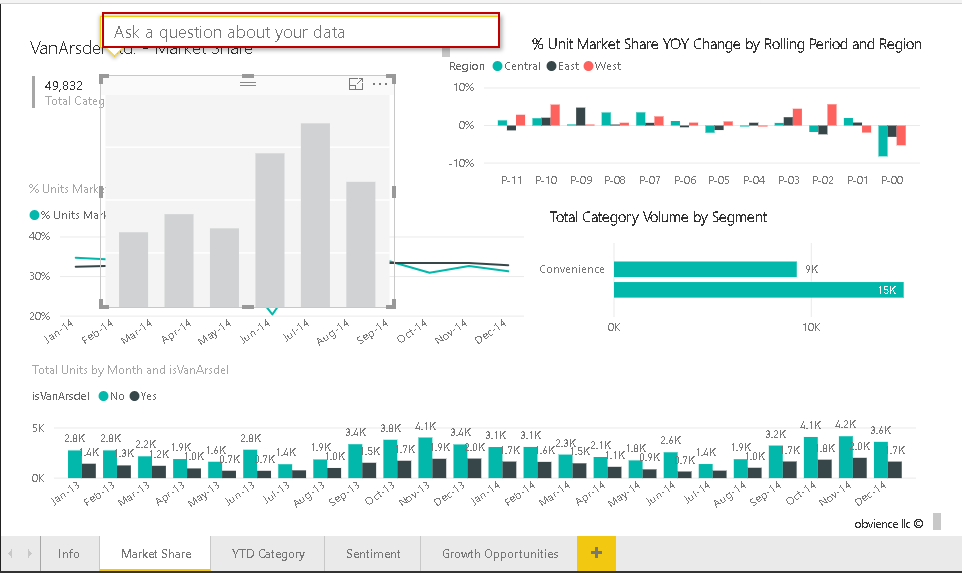
It also launches a window where it would display data or create visualizations. Adjust the size of this window and make some room in the report to display data properly.
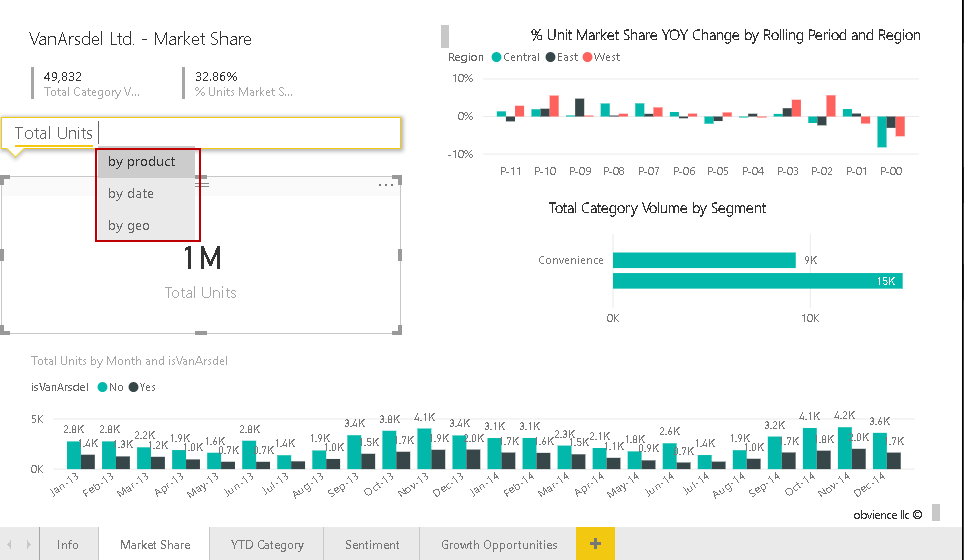
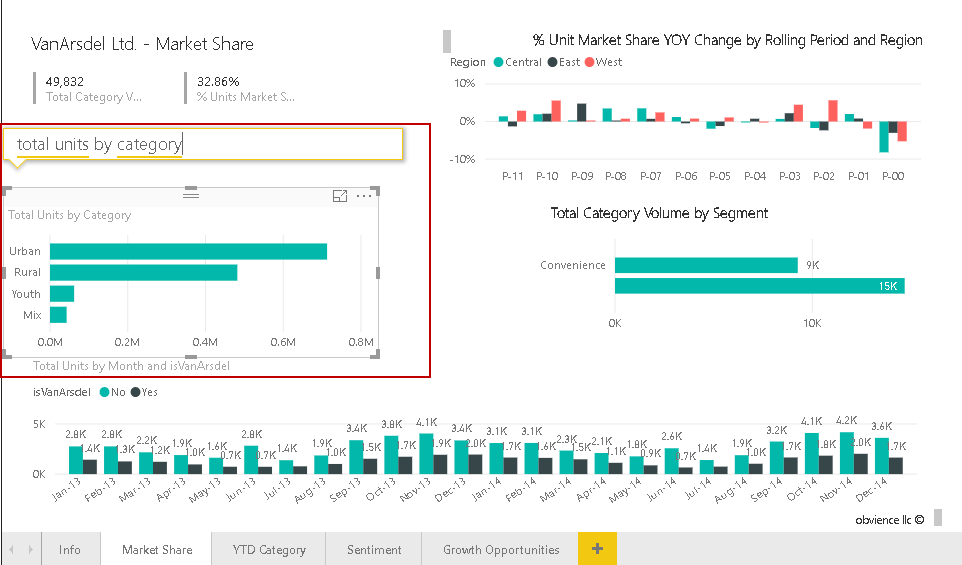
Let us start interaction with our data in natural language. When we start typing in the text box, it gives suggestion inline as well. In below example, you can see that once we type total units, we get a suggestion to get results by product, by date or by Geo.
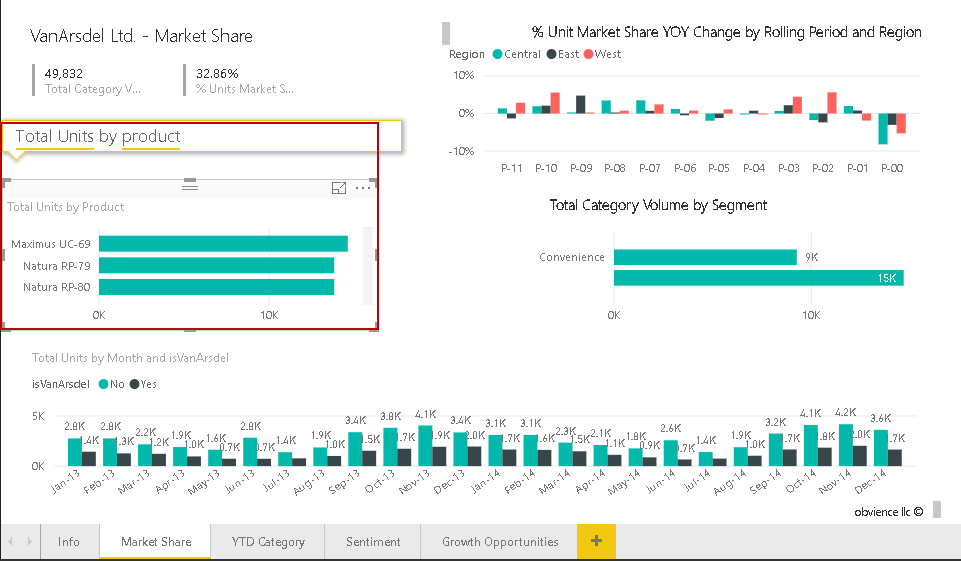
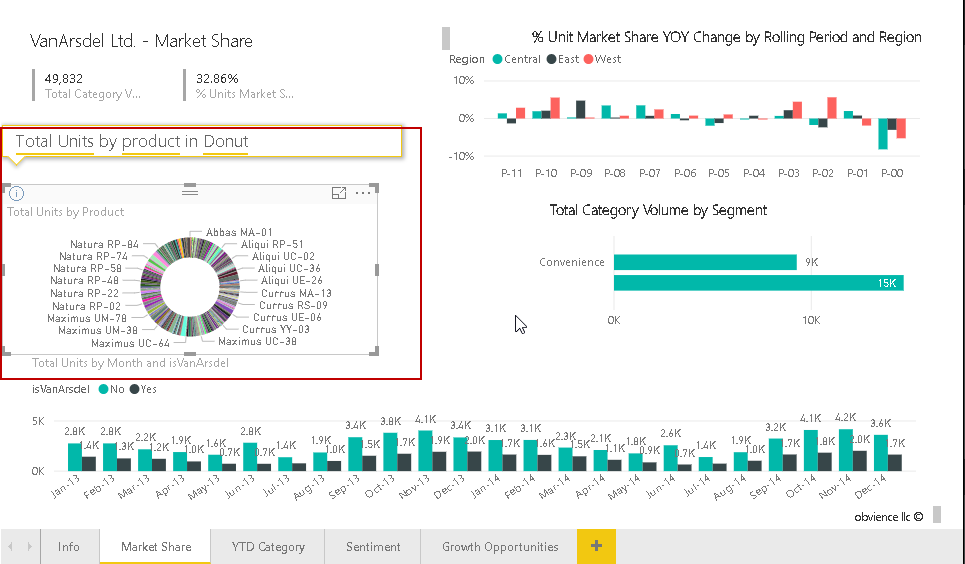
Let us enter in Q&A box ‘Total Units by product’ and we get the desired data output as shown here.
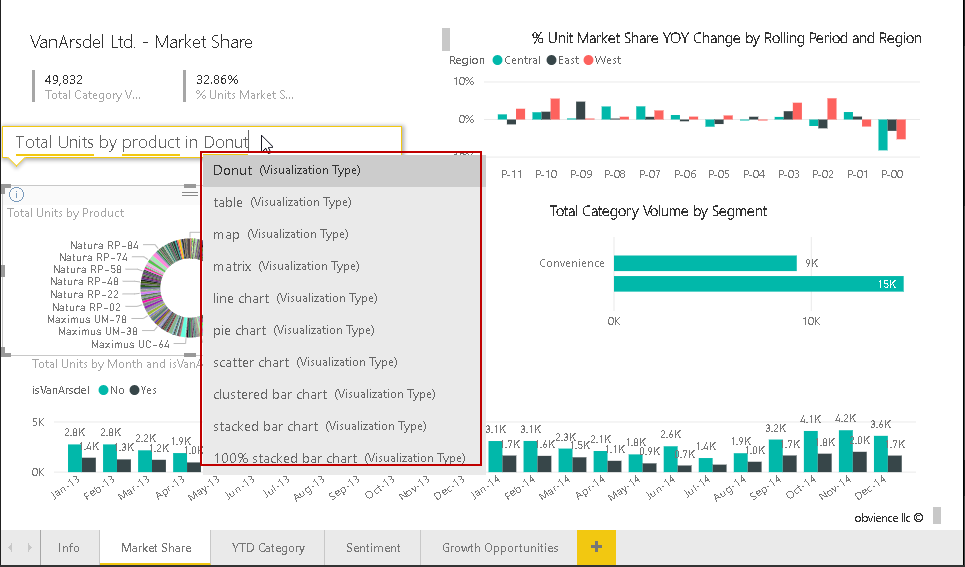
Now, change the question to represent this data into visualization form. In below screenshot, we want to represent data in Donut form. Once we type Donut, it identifies it and displays the visualization suggestions. However, it might not generate the visualization properly due to the data set.
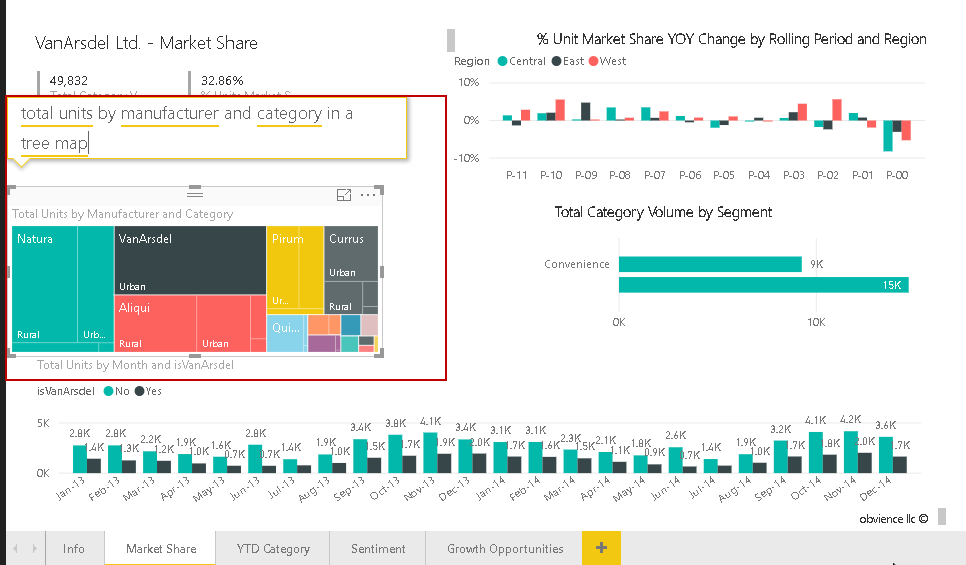
Now, we will again ask the question to Power BI data set.
Question: total units by manufacturer and category in a treemap chart
Question: show unit by year and the category, product
In the examples above, we saw that Q&A functionality gives an automated suggestion as per the column and the tables defined. Power BI Desktop Q& A is very smart language processing system.
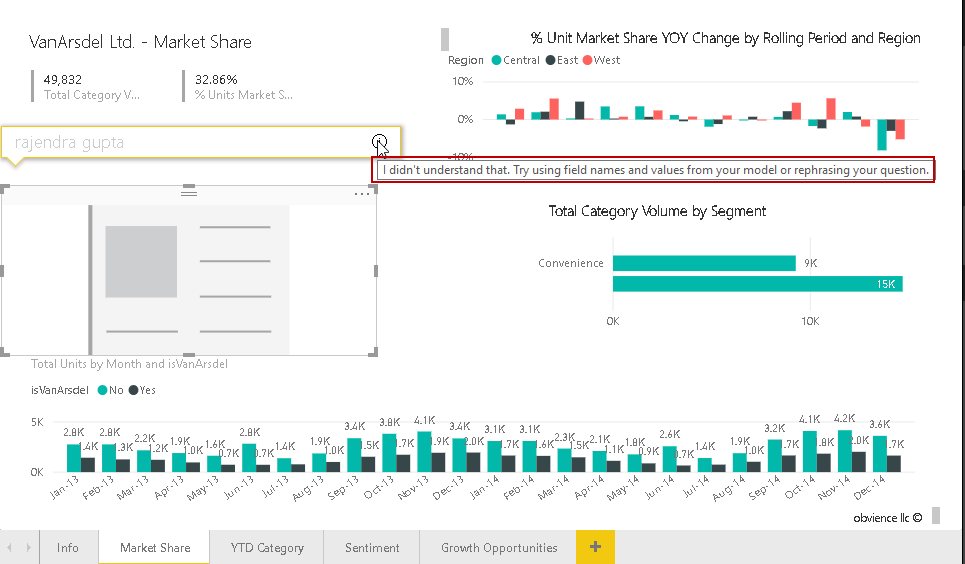
If you enter the text or question that Power BI does not understand, it gives the message accordingly. For example, just for testing purpose, I put my name into the Q&A box. It gives the error message ‘I didn’t understand that. Try using field names and values from your model or rephrasing your question’.
You can ask any question from the data set. Let me ask a question again to get the data of ‘show products sorted by the manufacturer’.
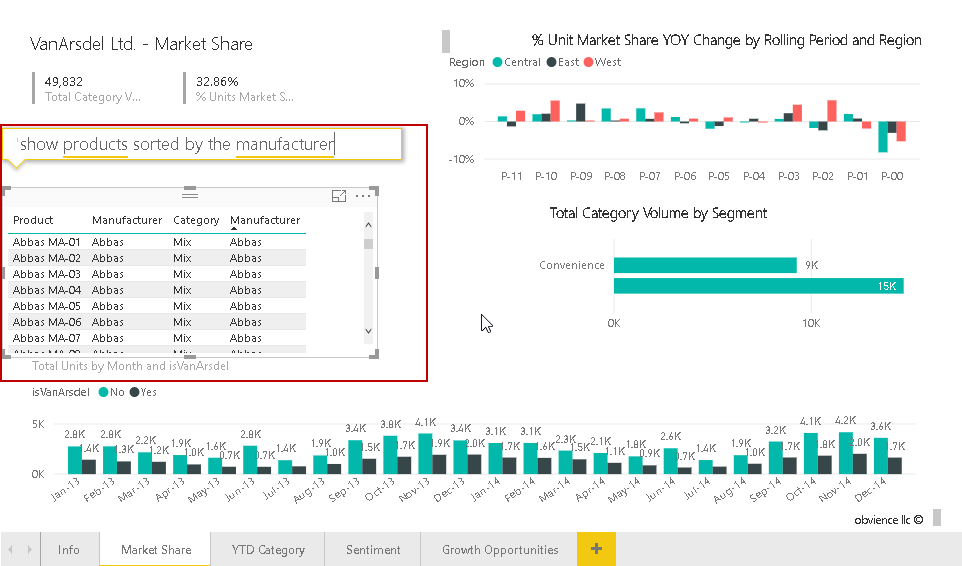
Until now, Q&A in Power BI Desktop allows interacting with the data with natural language and we do not have to do customization in order to get our results in multiple format or visuals.
Consideration to use Q&A in Power BI
As stated earlier, we use natural language to interact with the data in Power BI. When we ask any questions in Q&A, Power BI looks out for the keywords and makes assumptions about the data model. We should prepare our data set so that it can use this Q&A functionality. We should take a few considerations while preparing the data set.
-
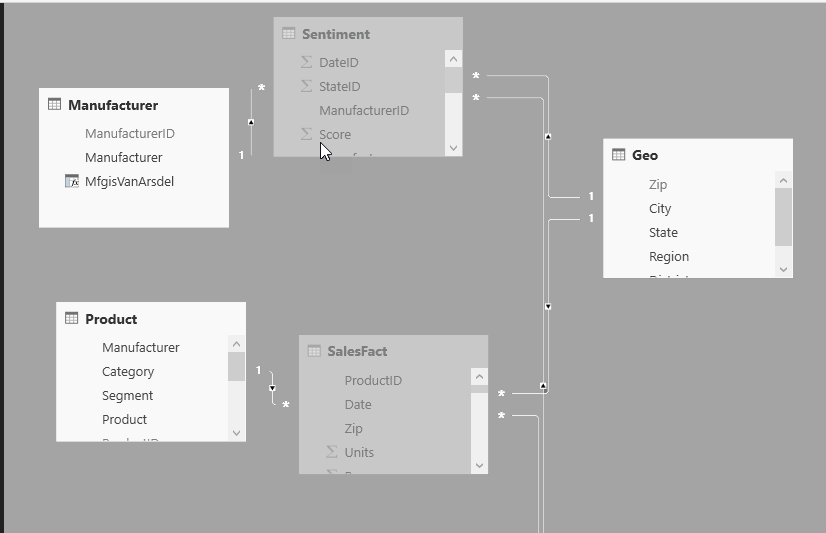
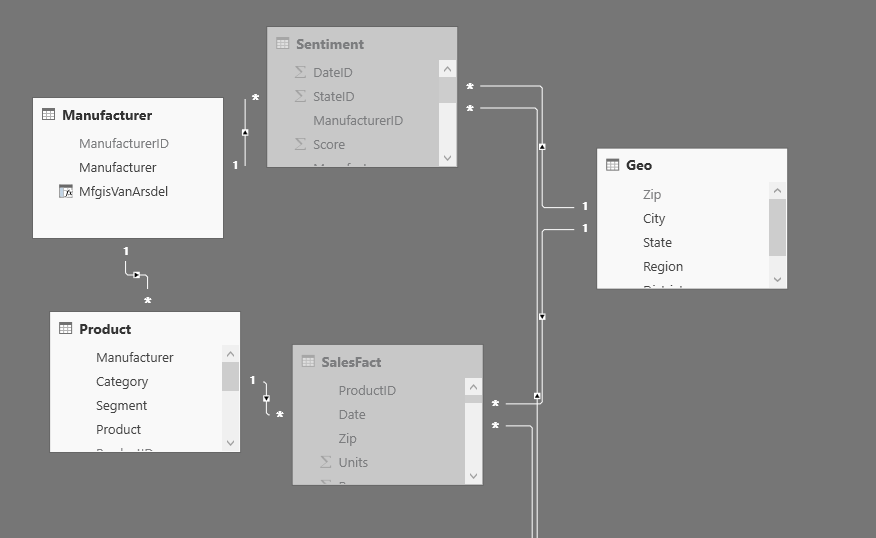
Data Relationship: we should establish the relationships between tables so that Q&A can join these tables and prepare the output. In our example above, if we do not have any relationship between the Manufacturer and the Product table, Q&A cannot join these tables.
Therefore, we cannot ask the questions like Show products order by manufacturer

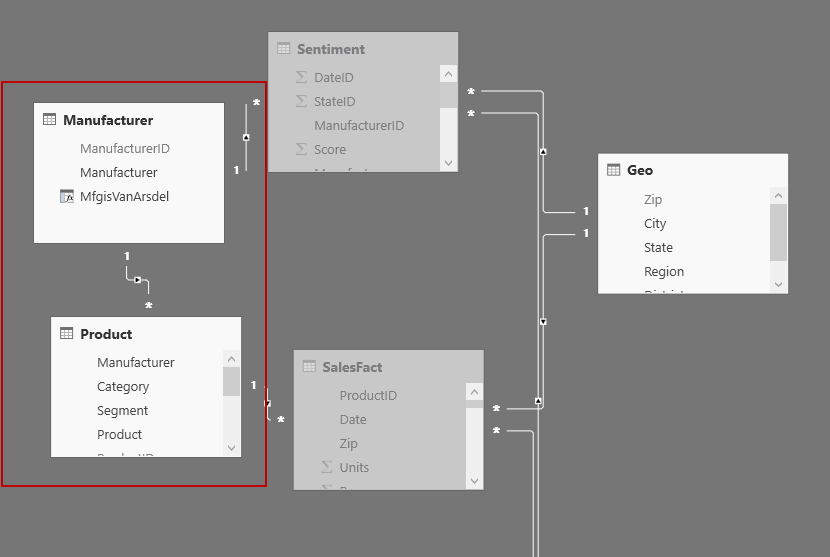
We should have the relationship between tables like below to get an answer to questions like Show products order by manufacturer.
-
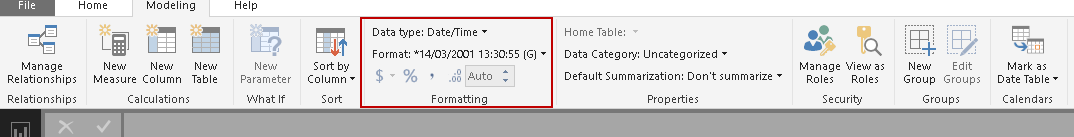
Data Types: We should have the proper data type for the imported data. Sometimes when we import data from various sources, it might not capture the correct data type. For example, date/time is referred to as string as well. If we define string on the date\time column, we will not get the proper output using Q&A. Q&A cannot interpret the string data in that scenario
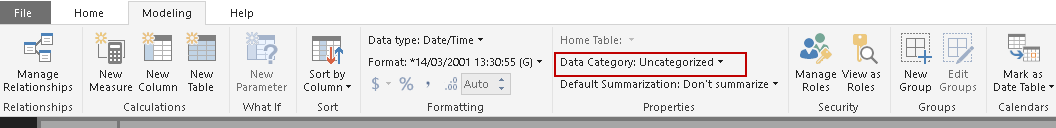
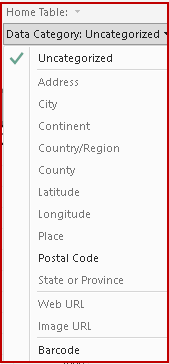
- Data Category: We can define the data category to provide additional information for the Q&A. This data category will help Q&A to evaluate the data set information and provide the result set
For example, a column might have information about the address, country, place, latitude, longitude, place, postal code etc.Q&A will use the data classification information to visualize the data.
- Normalize the data: In Q&A, it better to normalize the data. We might have all the information in a single table. In our example above, below are the normalized tables and their relationships together. It is the best practice to normalize the data into multiple tables with meaningful column names. It will help to Q&A to take the decision to visualize and prepare the data in the backend
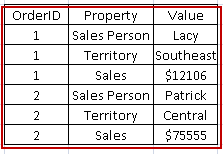
- Pivot tables: We should structure data to have a single column for each kind of data. Consider the below table. In this table, we have the table that contains the row having s a different property of the order. It would be difficult for Q&A to produce the result from this kind of table. If we ask question ‘show salesperson order by territory’, Q&A cannot produce the results because each column does not have similar kind of data
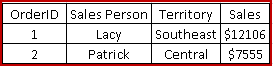
This table format should be like below. In this table, each column represents similar kind of data.
Conclusion
Q&A functionality in Power BI Desktop enables users to ask the question from the data set and easily get the results without any configuration or write complex codes. We can create visuals as well just by asking the questions. It gives the suggestions as well once we start typing the questions in Q&A box. I really found it a very useful tool to use natural language interaction with the data. You can explore this feature in your environment.
Table of contents

I am the author of the book "DP-300 Administering Relational Database on Microsoft Azure". I published more than 650 technical articles on MSSQLTips, SQLShack, Quest, CodingSight, and SeveralNines.
I am the creator of one of the biggest free online collections of articles on a single topic, with his 50-part series on SQL Server Always On Availability Groups.
Based on my contribution to the SQL Server community, I have been recognized as the prestigious Best Author of the Year continuously in 2019, 2020, and 2021 (2nd Rank) at SQLShack and the MSSQLTIPS champions award in 2020.
Personal Blog: https://www.dbblogger.com
I am always interested in new challenges so if you need consulting help, reach me at rajendra.gupta16@gmail.com
View all posts by Rajendra Gupta
- How to install PostgreSQL on Ubuntu - July 13, 2023
- How to use the CROSSTAB function in PostgreSQL - February 17, 2023
- Learn the PostgreSQL COALESCE command - January 19, 2023