
Introduction
In my last article entitled “Which fields do my reports actually use”, we had a quick look at a practical implementation of an XPATH query to obtain a list of database table fields being utilized by our reports. Reporting Services reports are really no more than XML documents. The fields utilized by our reports reside in Reporting Services datasets.
In that article, the eagle – eyed reader would have noted that only the first field for each dataset was pulled. This was done intentionally and was meant to act as an introduction to utilizing more complex techniques to pull the complete suite of data fields.
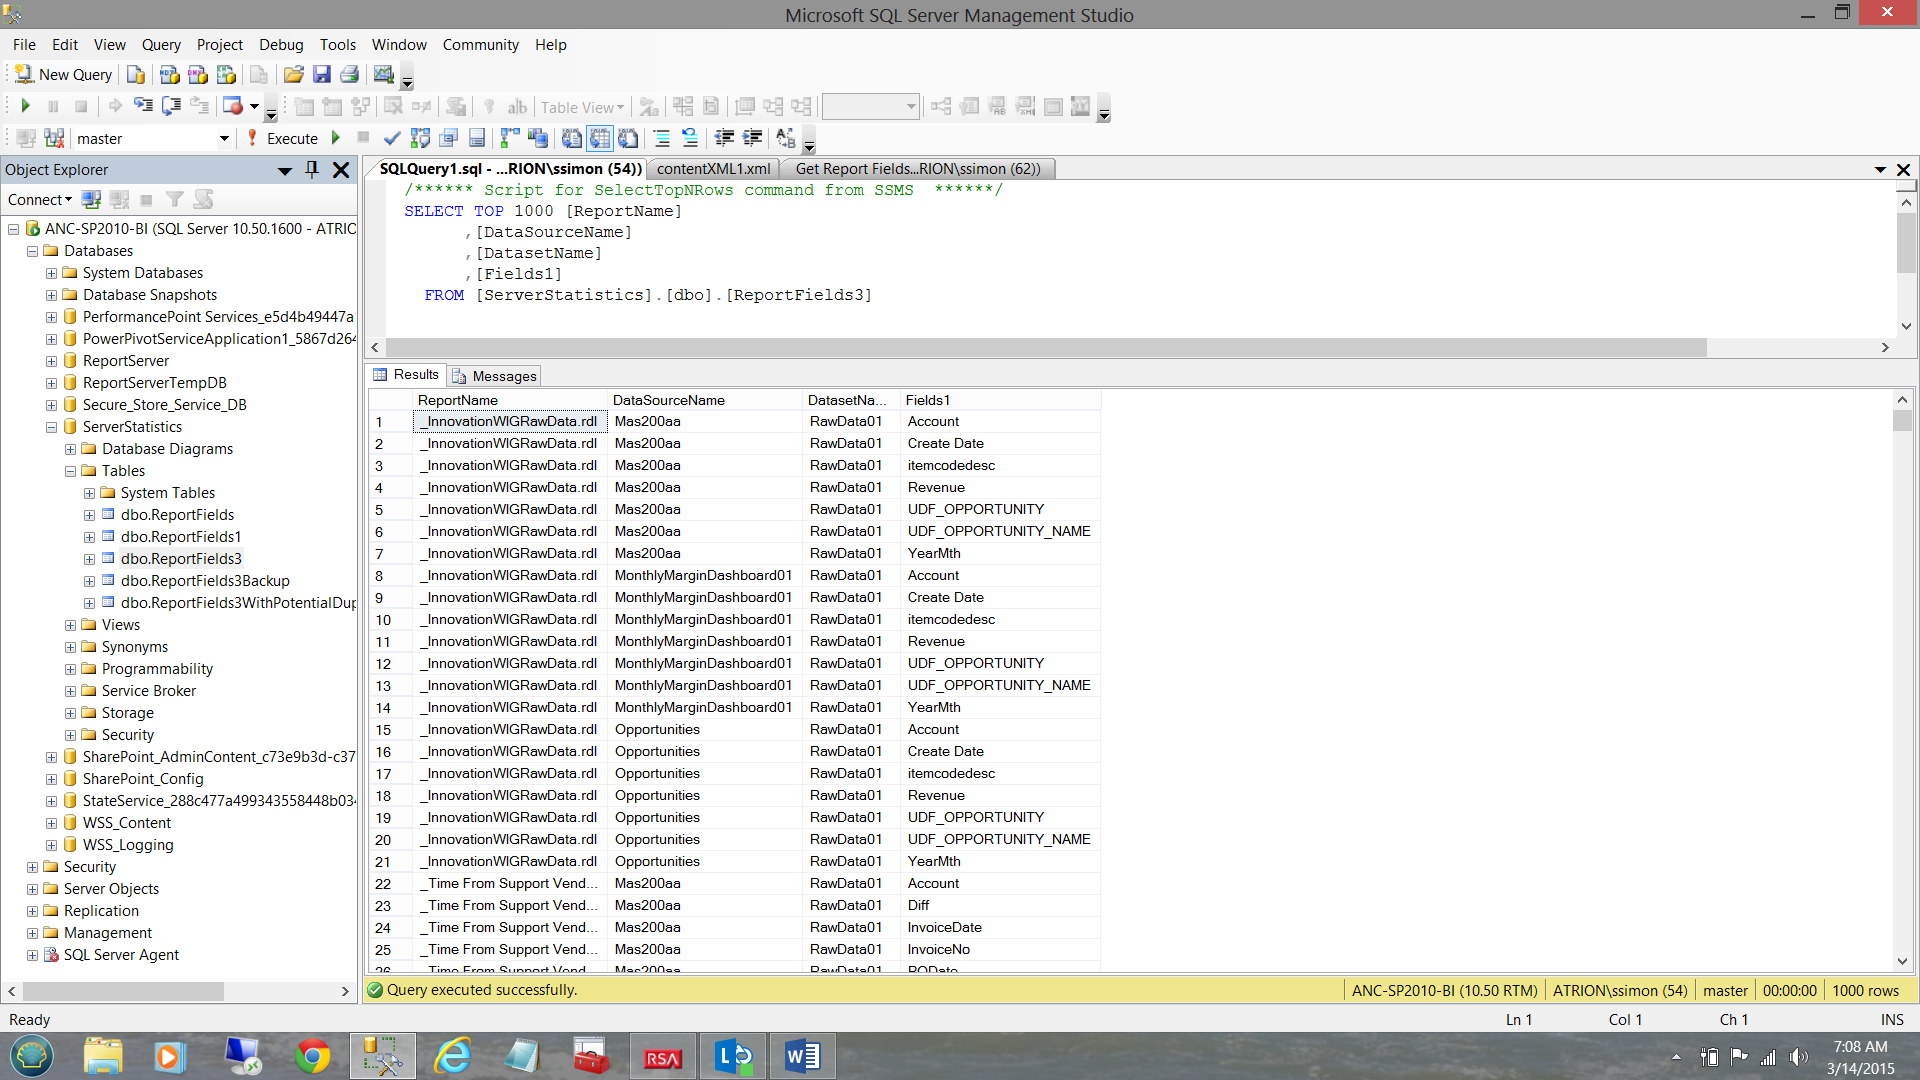
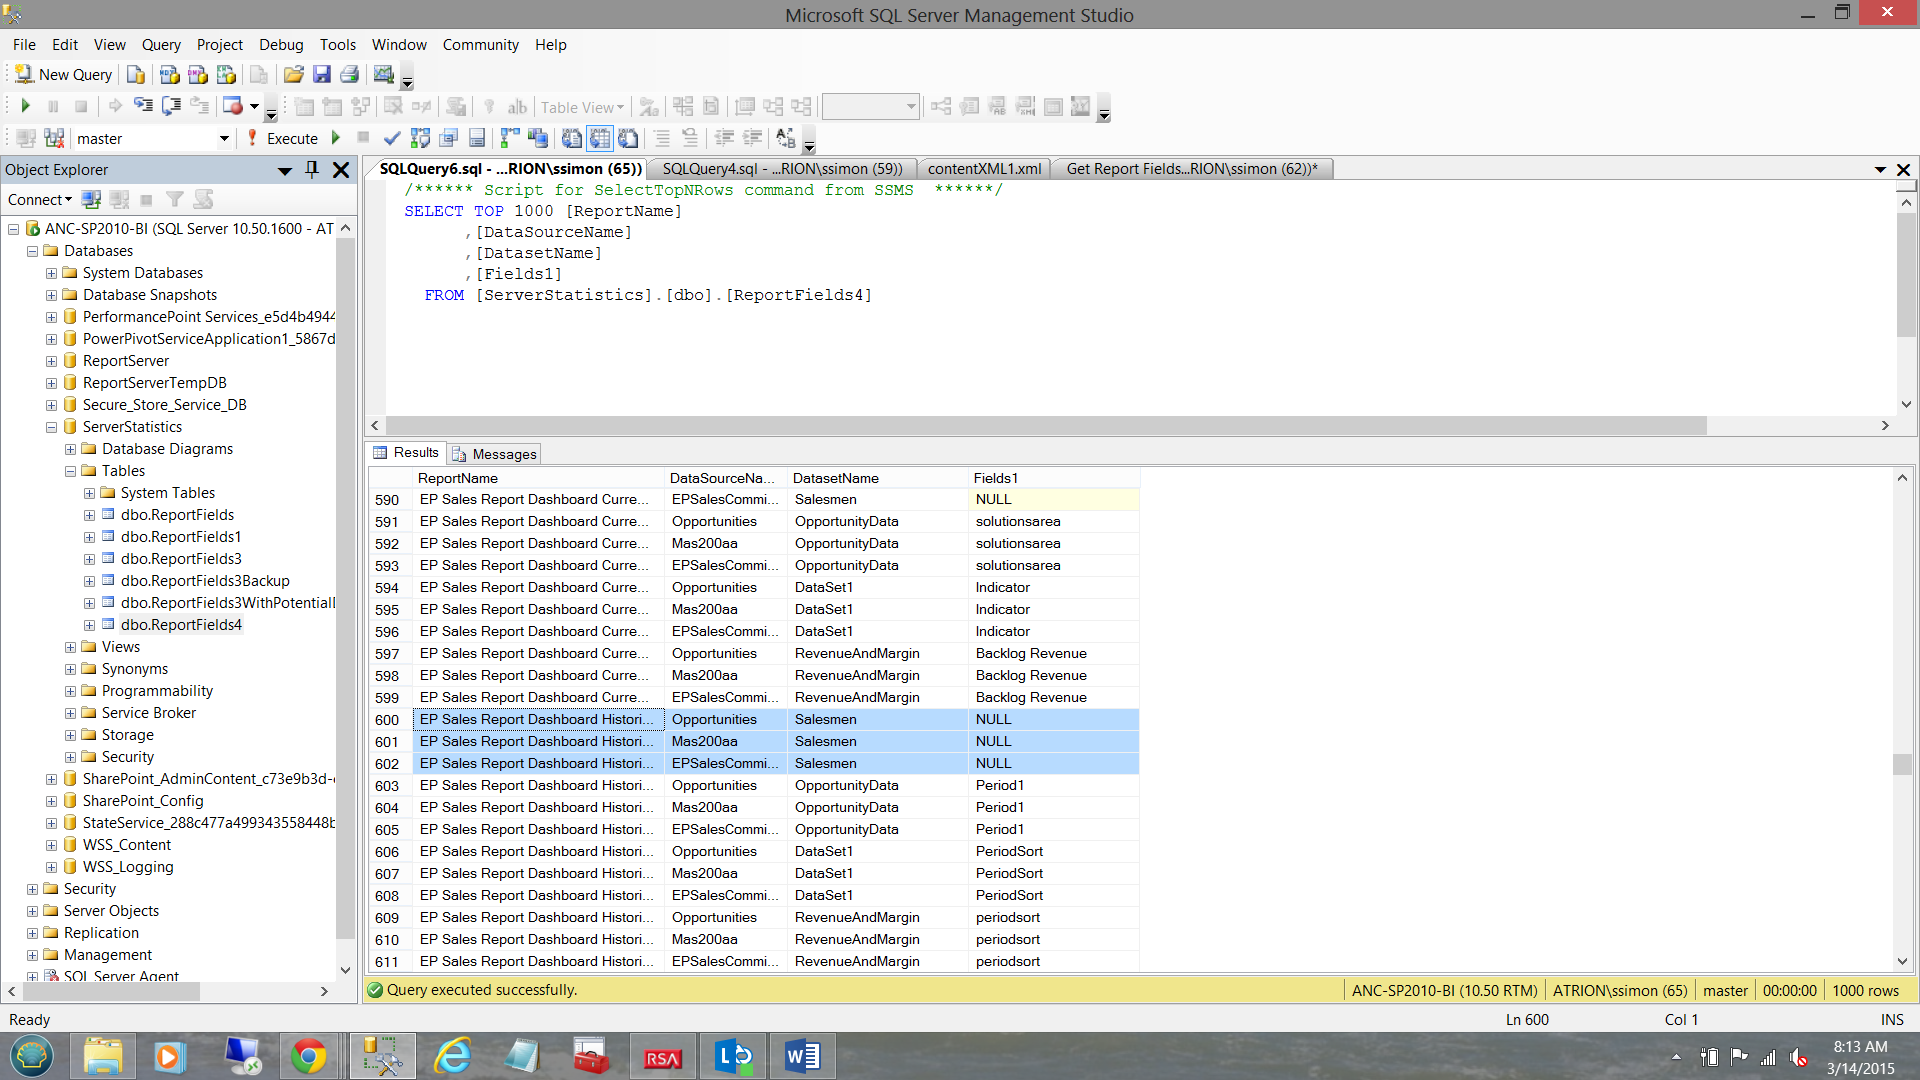
Today’s end goal (to pull all the fields) may be seen in the screen shot shown below:
Getting Started
The small snippet of code shown below helps us obtain the names of the “data fields” utilized by our reports that are resident on our report server. It renders the Report Path (where the report is located), the name of the report and the bulk of the data that we need which is found in an image field called “Content” which we convert to XML (see below).
|
1 2 3 4 5 6 7 8 9 |
SELECT RPT.Path AS ReportPath ,RPT.name AS ReportName ,CONVERT(xml, CONVERT(varbinary(max), RPT.content)) AS contentXML FROM [ReportServer].dbo.[Catalog] AS RPT INNER JOIN [ReportServer].dbo.ExecutionLogStorage Storage ON RPT.ItemID = Storage.ReportID WHERE RPT.Type = 2 |
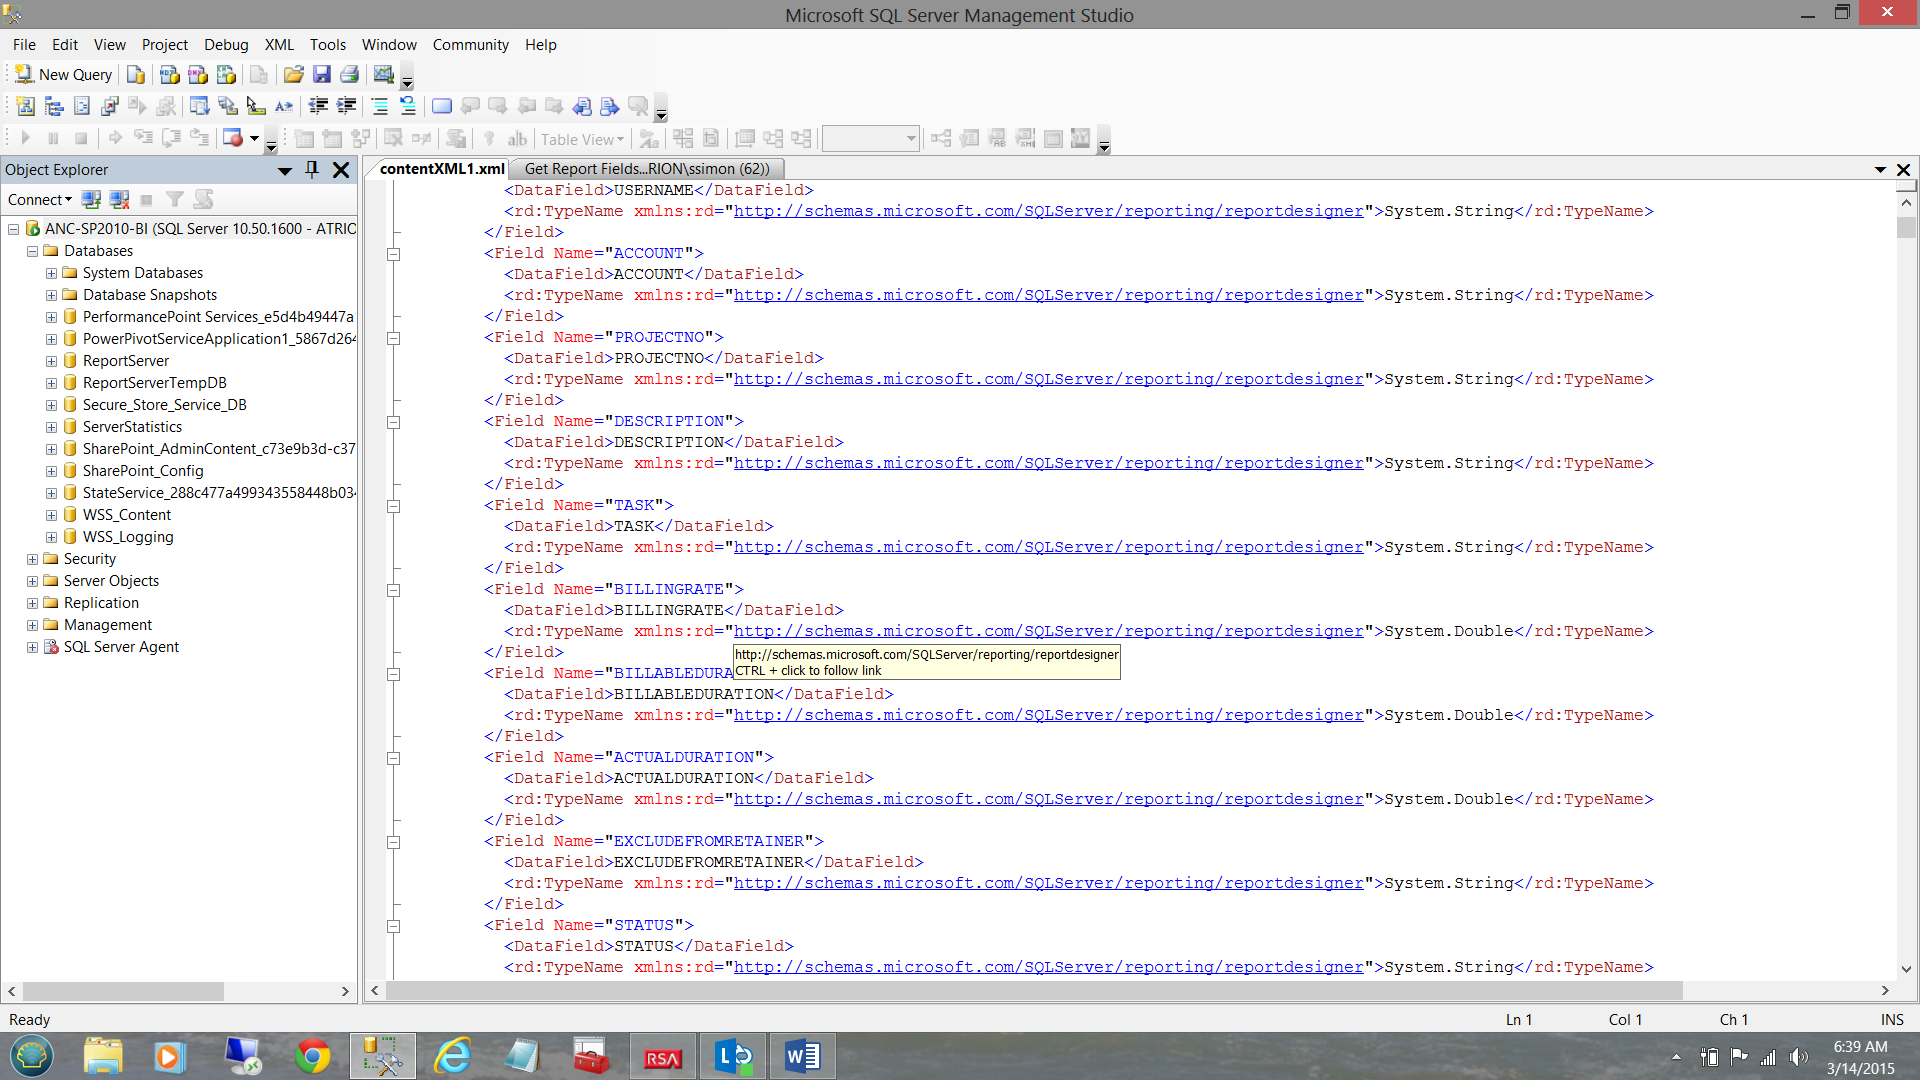
Obtaining the names of the dataset/reports fields is slightly more convoluted. In order to obtain this data we need to descend the following path (see the screen shot below).
/Report/DataSets/DataSet//Fields/Field/DataField
Our task is now to ensure that when we run this query, that all the necessary “report fields” are being successfully extracted. As always, the complete code listing may be found in Addenda 1.
One of the nagging issues that I have always encountered is that we are never really 100% confident of the maximum number of fields that a dataset will contain. In most of the dataset that I have utilized, I have found that the number of sibling fields/nodes rarely exceeds thirty fields per dataset.
We set our root path to Report/DataSets/DataSet
Obtaining the report name, the report path and the contentXML fields are fairly simple. They form the first portion of our “Select” statement (see below).
|
1 2 3 4 5 6 7 8 9 10 11 12 13 14 15 16 17 18 19 |
;WITH XMLNAMESPACES (DEFAULT 'http://schemas.microsoft.com/sqlserver/reporting/2010/01/reportdefinition' ,'http://schemas.microsoft.com/sqlserver/reporting/reportdesigner' AS rd) ,DEF AS (SELECT RPT.ReportPath,ReportName,contentXML ,Y.RptNode.value('@Name[1]', 'nvarchar(425)') AS DataSourceName ,R.RptNode.value('@Name[1]', 'nvarchar(425)') AS DataSetName …………. FROM (SELECT RPT.Path AS ReportPath ,RPT.name AS ReportName ,CONVERT(xml, CONVERT(varbinary(max), RPT.content)) AS contentXML FROM [ReportServer].dbo.[Catalog] AS RPT WHERE RPT.Type = 2 ) AS RPT |
The code snippet above, shows us the subquery containing these first three fields (i.e. RPT.ReportPath, ReportName, and contextXML) plus two additional fields in blue. The fields in blue are discussed in a few seconds.
This whole subquery may also be altered to ascertain if the report and fields have been utilized in the recent past (see below in bold text).
|
1 2 3 4 5 6 7 8 |
FROM (SELECT RPT.Path AS ReportPath ,RPT.name AS ReportName ,CONVERT(xml, CONVERT(varbinary(max), RPT.content)) AS contentXML FROM [ReportServer].dbo.[Catalog] AS RPT INNER JOIN [ReportServer].dbo.ExecutionLogStorage Storage ON RPT.ItemID = Storage.ReportID WHERE RPT.Type = 2 |
The complete code listing OF THIS QUERY may be found in Addenda 2.
When it comes to the DataSourceName and the DataSetName, we must JOIN back to the “Catalog” table (in the Report Server database) utilizing the “Content” field and the XPath statements to the DataSourceName and DataSetNameNodes. When working with XML we utilize a “cross APPLY” instead of an inner join(see below).
|
1 2 3 4 |
cross APPLY RPT.contentXML.nodes('/Report/DataSets/DataSet') AS R(RptNode) cross APPLY RPT.contentXML.nodes('/Report/DataSources/DataSource') AS Y(RptNode). |
As mentioned, these cross APPLY’s contain the path to the necessary leaf nodes where we shall be able to find the date source name and the name of the dataset (above and below).
|
1 2 3 4 5 |
,Y.RptNode.value('@Name[1]', 'nvarchar(425)') AS DataSourceName ,R.RptNode.value('@Name[1]', 'nvarchar(425)') AS DataSetName |
Obtaining the remaining fields
As discussed above, knowing the maximum number of fields that the largest of our report datasets contains, is always a conundrum. The ones that I utilize are normally no more than 30 fields, the reason being that most of my reports contain matrices that show data for twelve months (both actuals and goals). This clearly accounts for twenty four fields. The other six being descriptive.
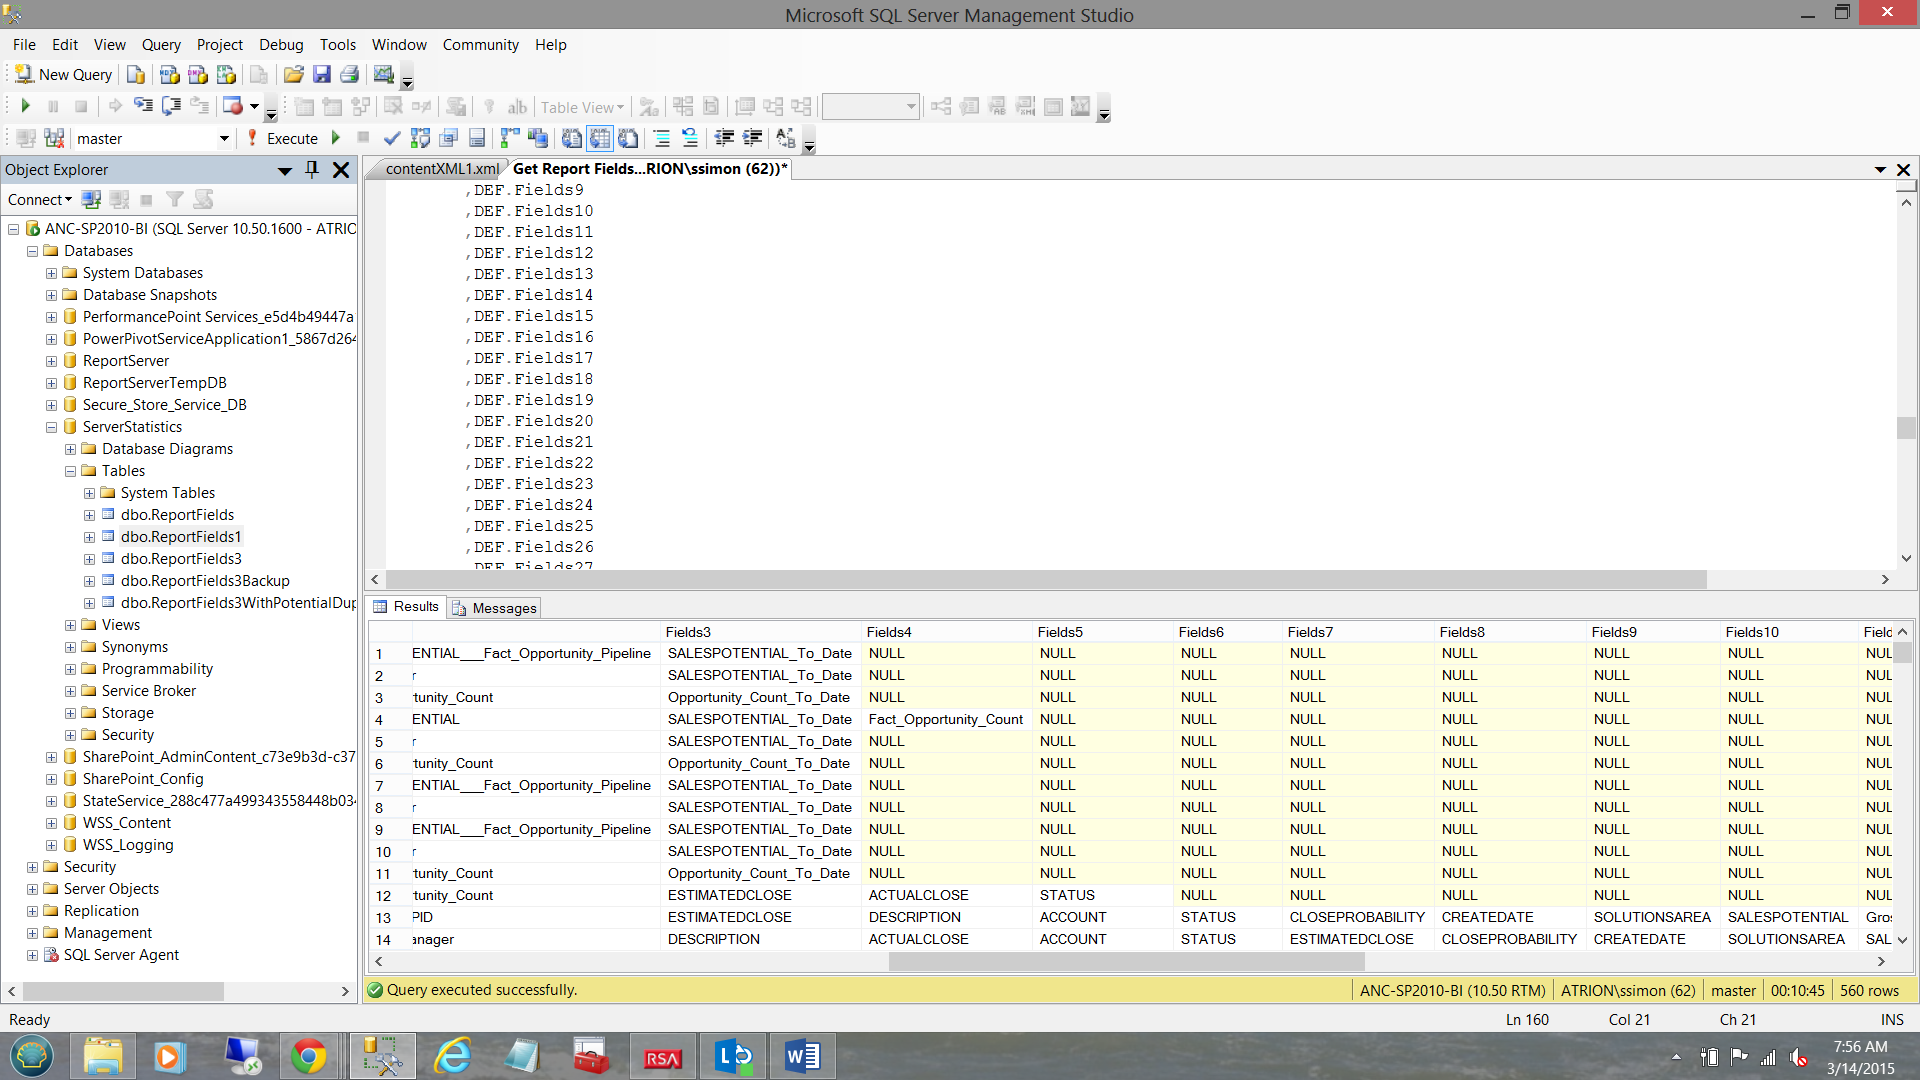
Working from the XPATH expression “R” (shown immediately above), we are now in a position to pull all thirty plus fields within any dataset (see below).
|
1 2 3 4 5 6 7 8 9 10 11 12 13 14 |
REPLACE(REPLACE(LTRIM((R.RptNode.value('(.//Fields/Field/DataField)[1]', 'nvarchar(4000)'))) ,'>', '>') ,'<', '<') AS Fields1 ,REPLACE(REPLACE(LTRIM((R.RptNode.value('(.//Fields/Field/DataField)[2]', 'nvarchar(4000)'))) ,'>', '>') ,'<', '<') AS Fields2 ,REPLACE(REPLACE(LTRIM((R.RptNode.value('(.//Fields/Field/DataField)[3]', 'nvarchar(4000)'))) ,'>', '>') ,'<', '<') AS Fields3 |
ALL the way through to Field31
|
1 2 3 4 5 6 7 8 9 10 |
REPLACE(REPLACE(LTRIM((R.RptNode.value('(.//Fields/Field/DataField)[30]', 'nvarchar(4000)'))) ,'>', '>') ,'<', '<') AS Fields30 ,REPLACE(REPLACE(LTRIM((R.RptNode.value('(.//Fields/Field/DataField)[31]', 'nvarchar(4000)'))) ,'>', '>') ,'<', '<') AS Fields31 |
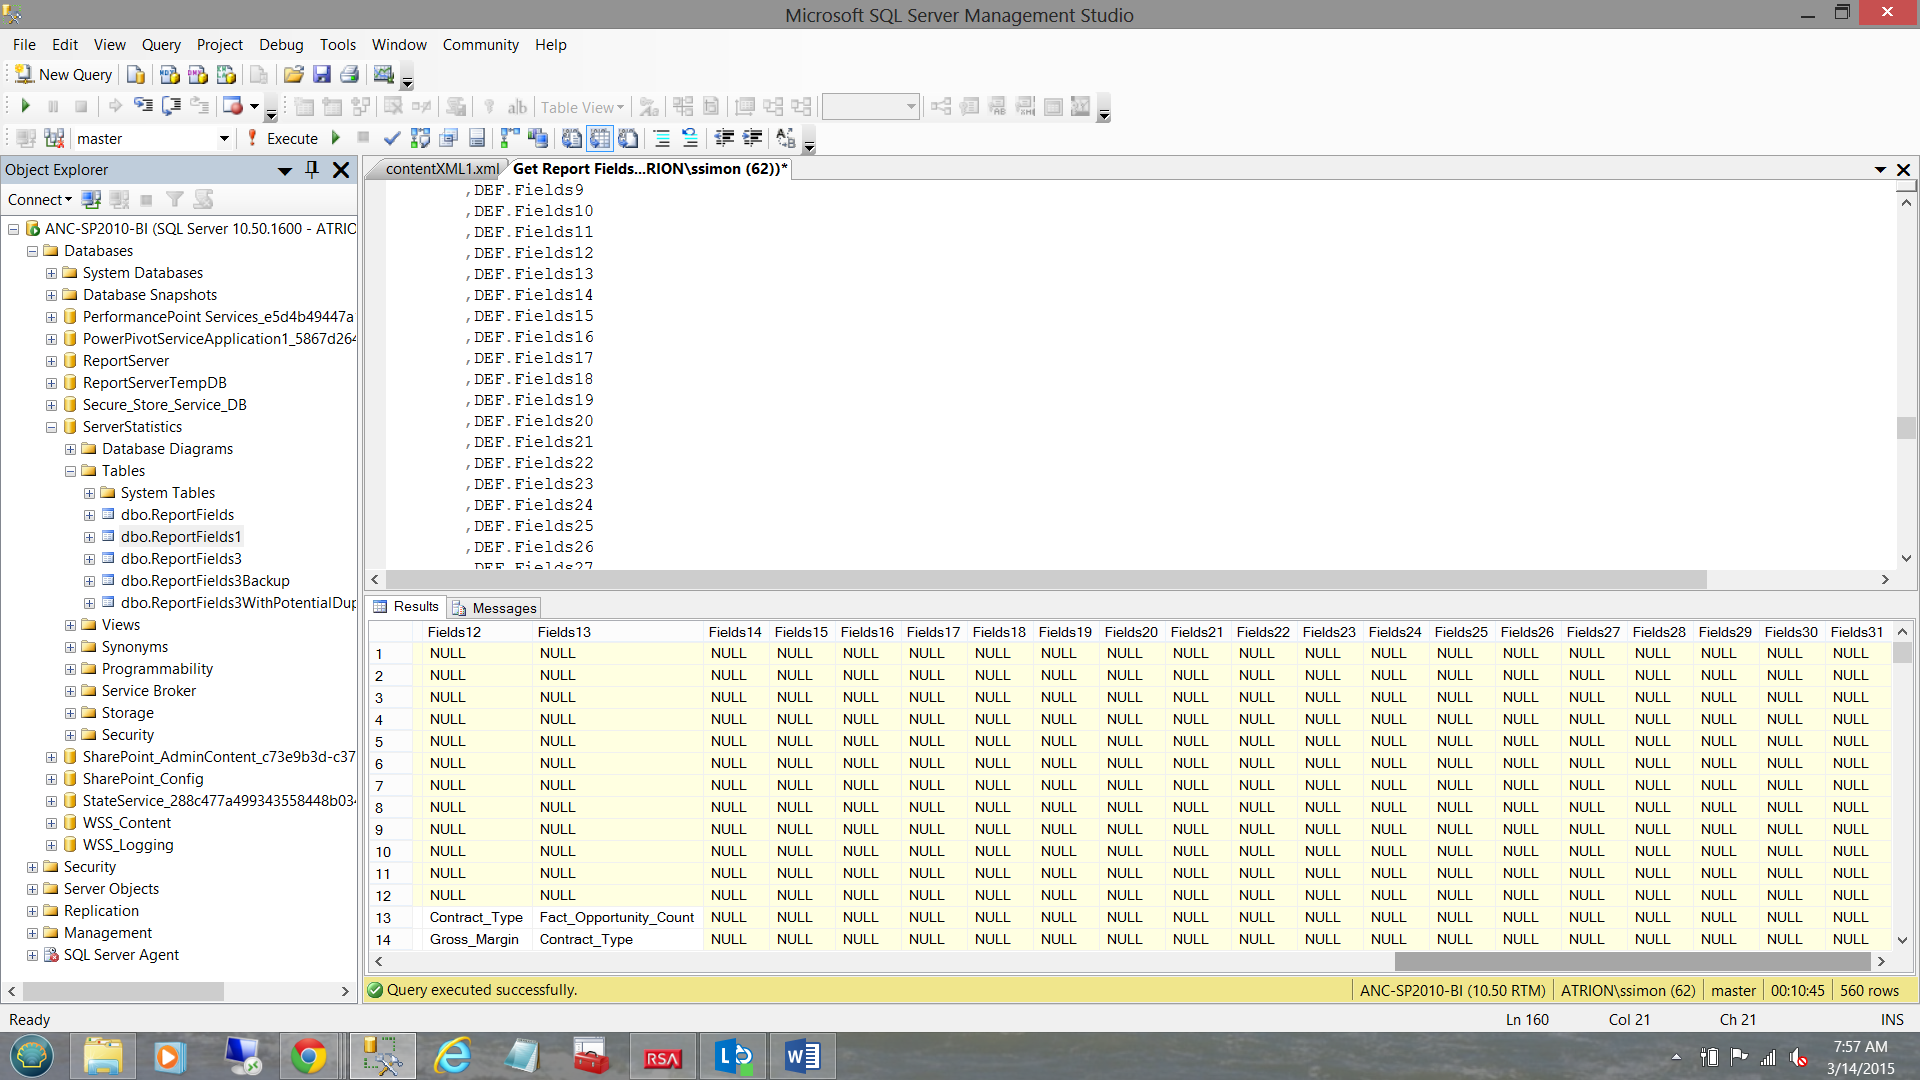
The observant reader will call “foul” as not all datasets will have thirty plus fields.
This is true, however those fields that do not exist will have “NULL” for the corresponding “Field” node value (see below).
…and
Obtaining our end list of report fields
Having obtained the name of the report, the data source name, the dataset name and a whole wad of other fields, we must now consolidate all of this into four distinct fields, “Reportname”, “DataSourceName”,”DataSetName” and “Fields1”. “Fields1” will contain the names of the report fields within each report (e.g. Last Name, First Name, City, State, Country etc.).
We achieve this by creating the following query.
|
1 2 3 4 5 6 7 8 9 10 11 12 13 14 |
select ReportName, DataSourceName, DatasetName,Fields1 into [ServerStatistics].dbo.ReportFields3 from #rawdata1 union all select ReportName, DataSourceName, DatasetName,Fields2 from #rawdata1 union all select ReportName, DataSourceName, DatasetName,Fields3 from #rawdata1 union all …………… select ReportName, DataSourceName, DatasetName,Fields29 from #rawdata1 union all select ReportName, DataSourceName, DatasetName,Fields30 from #rawdata1 union all select ReportName, DataSourceName, DatasetName,Fields31 from #rawdata1 |
Once loaded, we still have one last task to do and that is to remove those records that have null values (see below).
Once again, these values are NULL as there were no corresponding fields in the ‘SalesPerson” dataset (as an example) for perhaps “Field21” and “Field22”. The observant reader will note that at this stage the concept of “Fields2” through “Field31” no longer exist due to the “union”. The important point being that these records with NULL (as a value) must be removed from the recordset.
The said, we now issue the following T-SQL statement:
|
1 2 3 4 |
Delete from [ServerStatistics].dbo.ReportFields3 Where Fields1 is null |
Caveat Emptor
As with any process, we shall find the normal “gotcha’s”.
When I first attempted this exercise, my hair turned grey as 95% of the XML data would come out and the other 5% was NULL when it should NOT have been. The reason for this is related to the namespaces utilized by the XML.
Indications are that some of the XML data utilized the 2010/01 name spaces and others 2008/01 (see below).
|
1 2 3 4 5 6 7 8 9 10 11 12 13 14 |
;WITH XMLNAMESPACES (DEFAULT 'http://schemas.microsoft.com/sqlserver/reporting/2010/01/reportdefinition' ,'http://schemas.microsoft.com/sqlserver/reporting/reportdesigner' AS rd) ,DEF AS ;WITH XMLNAMESPACES (DEFAULT 'http://schemas.microsoft.com/sqlserver/reporting/2008/01/reportdefinition' ,'http://schemas.microsoft.com/sqlserver/reporting/reportdesigner' AS rd) ,DEF AS |
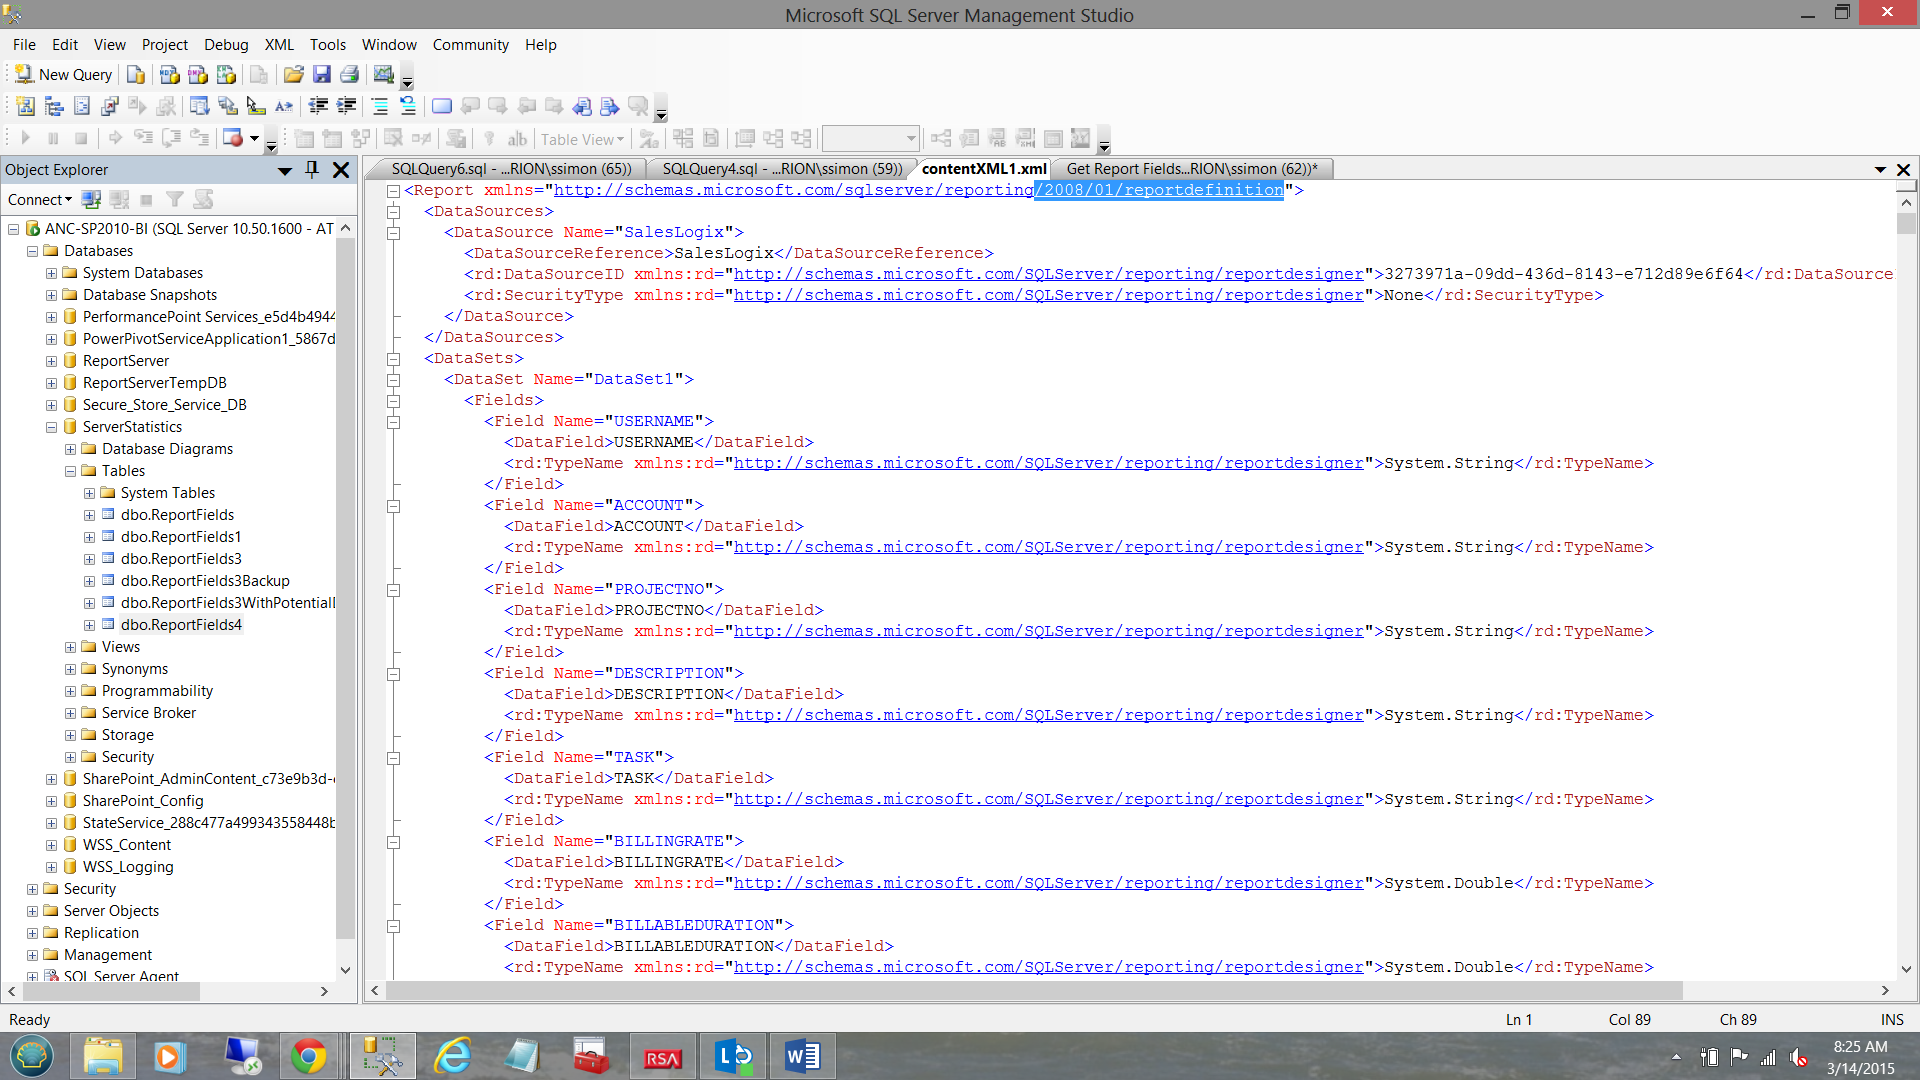
The screen shot above shows the “Content” field within the Reporting Services Database “Catalog” table, which requires the usage of the 2008 names spaces.
You have been warned!
Conclusions
When contemplating any database migration, one often tries to perform a bit of housekeeping prior to proceeding with the migration. In a recent migration to the cloud, the client wanted to have an inventory of the datasets and fields that were utilized by their reports and to remove unnecessary reports or unused reports (for that matter). In reality this is a double edged sword. In one case one tends to want to look at recent execution of reports as a guide line to what must be maintained, retained and moved. On the other hand, some reports tend to be seasonal and most enterprises truncate report server logs on a periodic basis; thus if one does not pay attention to this fact, potentially useful and important reports tend to fall through the cracks.
This said, Addenda 1 contains the code to be executed regardless of the last runs of the report.
Addenda 2 (on the other hand) is execution based and will render data based upon execution times from the log table.
So we come to the end of another “get together”. As always, should you have any questions or concerns, please feel free to contact me.
In the interim, happy programming!
Addenda 1
|
1 2 3 4 5 6 7 8 9 10 11 12 13 14 15 16 17 18 19 20 21 22 23 24 25 26 27 28 29 30 31 32 33 34 35 36 37 38 39 40 41 42 43 44 45 46 47 48 49 50 51 52 53 54 55 56 57 58 59 60 61 62 63 64 65 66 67 68 69 70 71 72 73 74 75 76 77 78 79 80 81 82 83 84 85 86 87 88 89 90 91 92 93 94 95 96 97 98 99 100 101 102 103 104 105 106 107 108 109 110 111 112 113 114 115 116 117 118 119 120 121 122 123 124 125 126 127 128 129 130 131 132 133 134 135 136 137 138 139 140 141 142 143 144 145 146 147 148 149 150 151 152 153 154 155 156 157 158 159 160 161 162 163 164 165 166 167 168 169 170 171 172 173 174 175 176 177 178 179 180 181 182 183 184 185 186 187 188 189 190 191 192 193 194 195 196 197 198 199 200 201 202 203 204 205 206 207 208 209 210 211 212 213 214 215 216 217 218 219 220 221 222 223 224 225 226 227 228 229 230 231 232 233 234 235 236 237 238 239 240 241 242 243 244 245 246 247 248 249 250 251 252 253 254 255 256 257 258 259 260 261 262 263 264 265 |
IF OBJECT_ID(N'tempdb..#rawdata1') IS NOT NULL BEGIN DROP TABLE #rawdata1 END IF OBJECT_ID(N'tempdb..#rawdata2') IS NOT NULL BEGIN DROP TABLE #rawdata2 END GO ;WITH XMLNAMESPACES (DEFAULT 'http://schemas.microsoft.com/sqlserver/reporting/2010/01/reportdefinition' ,'http://schemas.microsoft.com/sqlserver/reporting/reportdesigner' AS rd) ,DEF AS (SELECT RPT.ReportPath,ReportName,contentXML ,Y.RptNode.value('@Name[1]', 'nvarchar(425)') AS DataSourceName ,R.RptNode.value('@Name[1]', 'nvarchar(425)') AS DataSetName ,REPLACE(REPLACE(LTRIM((R.RptNode.value('(.//Fields/Field/DataField)[1]', 'nvarchar(4000)'))) ,'>', '>') ,'<', '<') AS Fields1 ,REPLACE(REPLACE(LTRIM((R.RptNode.value('(.//Fields/Field/DataField)[2]', 'nvarchar(4000)'))) ,'>', '>') ,'<', '<') AS Fields2 ,REPLACE(REPLACE(LTRIM((R.RptNode.value('(.//Fields/Field/DataField)[3]', 'nvarchar(4000)'))) ,'>', '>') ,'<', '<') AS Fields3 ,REPLACE(REPLACE(LTRIM((R.RptNode.value('(.//Fields/Field/DataField)[4]', 'nvarchar(4000)'))) ,'>', '>') ,'<', '<') AS Fields4 ,REPLACE(REPLACE(LTRIM((R.RptNode.value('(.//Fields/Field/DataField)[5]', 'nvarchar(4000)'))) ,'>', '>') ,'<', '<') AS Fields5 ,REPLACE(REPLACE(LTRIM((R.RptNode.value('(.//Fields/Field/DataField)[6]', 'nvarchar(4000)'))) ,'>', '>') ,'<', '<') AS Fields6 ,REPLACE(REPLACE(LTRIM((R.RptNode.value('(.//Fields/Field/DataField)[7]', 'nvarchar(4000)'))) ,'>', '>') ,'<', '<') AS Fields7 ,REPLACE(REPLACE(LTRIM((R.RptNode.value('(.//Fields/Field/DataField)[8]', 'nvarchar(4000)'))) ,'>', '>') ,'<', '<') AS Fields8 ,REPLACE(REPLACE(LTRIM((R.RptNode.value('(.//Fields/Field/DataField)[9]', 'nvarchar(4000)'))) ,'>', '>') ,'<', '<') AS Fields9 ,REPLACE(REPLACE(LTRIM((R.RptNode.value('(.//Fields/Field/DataField)[10]', 'nvarchar(4000)'))) ,'>', '>') ,'<', '<') AS Fields10 ,REPLACE(REPLACE(LTRIM((R.RptNode.value('(.//Fields/Field/DataField)[11]', 'nvarchar(4000)'))) ,'>', '>') ,'<', '<') AS Fields11 ,REPLACE(REPLACE(LTRIM((R.RptNode.value('(.//Fields/Field/DataField)[12]', 'nvarchar(4000)'))) ,'>', '>') ,'<', '<') AS Fields12 ,REPLACE(REPLACE(LTRIM((R.RptNode.value('(.//Fields/Field/DataField)[13]', 'nvarchar(4000)'))) ,'>', '>') ,'<', '<') AS Fields13 ,REPLACE(REPLACE(LTRIM((R.RptNode.value('(.//Fields/Field/DataField)[14]', 'nvarchar(4000)'))) ,'>', '>') ,'<', '<') AS Fields14 ,REPLACE(REPLACE(LTRIM((R.RptNode.value('(.//Fields/Field/DataField)[15]', 'nvarchar(4000)'))) ,'>', '>') ,'<', '<') AS Fields15 ,REPLACE(REPLACE(LTRIM((R.RptNode.value('(.//Fields/Field/DataField)[16]', 'nvarchar(4000)'))) ,'>', '>') ,'<', '<') AS Fields16 ,REPLACE(REPLACE(LTRIM((R.RptNode.value('(.//Fields/Field/DataField)[17]', 'nvarchar(4000)'))) ,'>', '>') ,'<', '<') AS Fields17 ,REPLACE(REPLACE(LTRIM((R.RptNode.value('(.//Fields/Field/DataField)[18]', 'nvarchar(4000)'))) ,'>', '>') ,'<', '<') AS Fields18 ,REPLACE(REPLACE(LTRIM((R.RptNode.value('(.//Fields/Field/DataField)[19]', 'nvarchar(4000)'))) ,'>', '>') ,'<', '<') AS Fields19 ,REPLACE(REPLACE(LTRIM((R.RptNode.value('(.//Fields/Field/DataField)[20]', 'nvarchar(4000)'))) ,'>', '>') ,'<', '<') AS Fields20 ,REPLACE(REPLACE(LTRIM((R.RptNode.value('(.//Fields/Field/DataField)[21]', 'nvarchar(4000)'))) ,'>', '>') ,'<', '<') AS Fields21 ,REPLACE(REPLACE(LTRIM((R.RptNode.value('(.//Fields/Field/DataField)[22]', 'nvarchar(4000)'))) ,'>', '>') ,'<', '<') AS Fields22 ,REPLACE(REPLACE(LTRIM((R.RptNode.value('(.//Fields/Field/DataField)[23]', 'nvarchar(4000)'))) ,'>', '>') ,'<', '<') AS Fields23 ,REPLACE(REPLACE(LTRIM((R.RptNode.value('(.//Fields/Field/DataField)[24]', 'nvarchar(4000)'))) ,'>', '>') ,'<', '<') AS Fields24 ,REPLACE(REPLACE(LTRIM((R.RptNode.value('(.//Fields/Field/DataField)[25]', 'nvarchar(4000)'))) ,'>', '>') ,'<', '<') AS Fields25 ,REPLACE(REPLACE(LTRIM((R.RptNode.value('(.//Fields/Field/DataField)[26]', 'nvarchar(4000)'))) ,'>', '>') ,'<', '<') AS Fields26 ,REPLACE(REPLACE(LTRIM((R.RptNode.value('(.//Fields/Field/DataField)[27]', 'nvarchar(4000)'))) ,'>', '>') ,'<', '<') AS Fields27 ,REPLACE(REPLACE(LTRIM((R.RptNode.value('(.//Fields/Field/DataField)[28]', 'nvarchar(4000)'))) ,'>', '>') ,'<', '<') AS Fields28 ,REPLACE(REPLACE(LTRIM((R.RptNode.value('(.//Fields/Field/DataField)[29]', 'nvarchar(4000)'))) ,'>', '>') ,'<', '<') AS Fields29 ,REPLACE(REPLACE(LTRIM((R.RptNode.value('(.//Fields/Field/DataField)[30]', 'nvarchar(4000)'))) ,'>', '>') ,'<', '<') AS Fields30 ,REPLACE(REPLACE(LTRIM((R.RptNode.value('(.//Fields/Field/DataField)[31]', 'nvarchar(4000)'))) ,'>', '>') ,'<', '<') AS Fields31 FROM (SELECT RPT.Path AS ReportPath ,RPT.name AS ReportName ,CONVERT(xml, CONVERT(varbinary(max), RPT.content)) AS contentXML FROM [ReportServer].dbo.[Catalog] AS RPT WHERE RPT.Type = 2 ) AS RPT cross APPLY RPT.contentXML.nodes('/Report/DataSets/DataSet') AS R(RptNode) cross APPLY RPT.contentXML.nodes('/Report/DataSources/DataSource') AS Y(RptNode) ) SELECT DEF.ReportPath ,contentXML ,Def.Reportname ,DEF.DataSourceName ,DEF.DataSetName ,DEF.Fields1 ,DEF.Fields2 ,DEF.Fields3 ,DEF.Fields4 ,DEF.Fields5 ,DEF.Fields6 ,DEF.Fields7 ,DEF.Fields8 ,DEF.Fields9 ,DEF.Fields10 ,DEF.Fields11 ,DEF.Fields12 ,DEF.Fields13 ,DEF.Fields14 ,DEF.Fields15 ,DEF.Fields16 ,DEF.Fields17 ,DEF.Fields18 ,DEF.Fields19 ,DEF.Fields20 ,DEF.Fields21 ,DEF.Fields22 ,DEF.Fields23 ,DEF.Fields24 ,DEF.Fields25 ,DEF.Fields26 ,DEF.Fields27 ,DEF.Fields28 ,DEF.Fields29 ,DEF.Fields30 ,DEF.Fields31 into #rawdata1 FROM DEF go select ReportName, DataSourceName, DatasetName,Fields1 into [ServerStatistics].dbo.ReportFields3 from #rawdata1 union all select ReportName, DataSourceName, DatasetName,Fields2 from #rawdata1 union all select ReportName, DataSourceName, DatasetName,Fields3 from #rawdata1 union all select ReportName, DataSourceName, DatasetName,Fields4 from #rawdata1 union all select ReportName, DataSourceName, DatasetName,Fields5 from #rawdata1 union all select ReportName, DataSourceName, DatasetName,Fields6 from #rawdata1 union all select ReportName, DataSourceName, DatasetName,Fields7 from #rawdata1 union all select ReportName, DataSourceName, DatasetName,Fields8 from #rawdata1 union all select ReportName, DataSourceName, DatasetName,Fields9 from #rawdata1 union all select ReportName, DataSourceName, DatasetName,Fields10 from #rawdata1 union all select ReportName, DataSourceName, DatasetName,Fields11 from #rawdata1 union all select ReportName, DataSourceName, DatasetName,Fields12 from #rawdata1 union all select ReportName, DataSourceName, DatasetName,Fields13 from #rawdata1 union all select ReportName, DataSourceName, DatasetName,Fields14 from #rawdata1 union all select ReportName, DataSourceName, DatasetName,Fields15 from #rawdata1 union all select ReportName, DataSourceName, DatasetName,Fields16 from #rawdata1 union all select ReportName, DataSourceName, DatasetName,Fields17 from #rawdata1 union all select ReportName, DataSourceName, DatasetName,Fields18 from #rawdata1 union all select ReportName, DataSourceName, DatasetName,Fields19 from #rawdata1 union all select ReportName, DataSourceName, DatasetName,Fields20 from #rawdata1 union all select ReportName, DataSourceName, DatasetName,Fields21 from #rawdata1 union all select ReportName, DataSourceName, DatasetName,Fields22 from #rawdata1 union all select ReportName, DataSourceName, DatasetName,Fields23 from #rawdata1 union all select ReportName, DataSourceName, DatasetName,Fields24 from #rawdata1 union all select ReportName, DataSourceName, DatasetName,Fields25 from #rawdata1 union all select ReportName, DataSourceName, DatasetName,Fields26 from #rawdata1 union all select ReportName, DataSourceName, DatasetName,Fields27 from #rawdata1 union all select ReportName, DataSourceName, DatasetName,Fields28 from #rawdata1 union all select ReportName, DataSourceName, DatasetName,Fields29 from #rawdata1 union all select ReportName, DataSourceName, DatasetName,Fields30 from #rawdata1 union all select ReportName, DataSourceName, DatasetName,Fields31 from #rawdata1 GO -- Remove the NULL records from the table. That is, where Fields1 is NULL as there are NO --values for these nodes. Delete from [ServerStatistics].dbo.ReportFields3 Where Fields1 is null |
Addenda 2
Code to report fields based upon recent usage
|
1 2 3 4 5 6 7 8 9 10 11 12 13 14 15 16 17 18 19 20 21 22 23 24 25 26 27 28 29 30 31 32 33 34 35 36 37 38 39 40 41 42 43 44 45 46 47 48 49 50 51 52 53 54 55 56 57 58 59 60 61 62 63 64 65 66 67 68 69 70 71 72 73 74 75 76 77 78 79 80 81 82 83 84 85 86 87 88 89 90 91 92 93 94 95 96 97 98 99 100 101 102 103 104 105 106 107 108 109 110 111 112 113 114 115 116 117 118 119 120 121 122 123 124 125 126 127 128 129 130 131 132 133 134 135 136 137 138 139 140 141 142 143 144 145 146 147 148 149 150 151 152 153 154 155 156 157 158 159 160 161 162 163 164 165 166 167 168 169 170 171 172 173 174 175 176 177 178 179 180 181 182 183 184 185 186 187 188 189 190 191 192 193 194 195 196 197 198 199 200 201 202 203 204 205 206 207 208 209 210 211 212 213 214 215 216 217 218 219 220 221 222 223 224 225 226 227 228 229 230 231 232 233 234 235 236 237 238 239 240 241 242 243 244 245 246 247 248 249 250 251 252 253 254 255 256 257 258 259 260 261 262 263 264 265 |
IF OBJECT_ID(N'tempdb..#rawdata1') IS NOT NULL BEGIN DROP TABLE #rawdata1 END IF OBJECT_ID(N'tempdb..#rawdata2') IS NOT NULL BEGIN DROP TABLE #rawdata2 END GO ;WITH XMLNAMESPACES (DEFAULT 'http://schemas.microsoft.com/sqlserver/reporting/2008/01/reportdefinition' ,'http://schemas.microsoft.com/sqlserver/reporting/reportdesigner' AS rd) ,DEF AS (SELECT RPT.ReportPath,ReportName,contentXML ,Y.RptNode.value('@Name[1]', 'nvarchar(425)') AS DataSourceName ,R.RptNode.value('@Name[1]', 'nvarchar(425)') AS DataSetName ,REPLACE(REPLACE(LTRIM((R.RptNode.value('(.//Fields/Field/DataField)[1]', 'nvarchar(4000)'))) ,'>', '>') ,'<', '<') AS Fields1 ,REPLACE(REPLACE(LTRIM((R.RptNode.value('(.//Fields/Field/DataField)[2]', 'nvarchar(4000)'))) ,'>', '>') ,'<', '<') AS Fields2 ,REPLACE(REPLACE(LTRIM((R.RptNode.value('(.//Fields/Field/DataField)[3]', 'nvarchar(4000)'))) ,'>', '>') ,'<', '<') AS Fields3 ,REPLACE(REPLACE(LTRIM((R.RptNode.value('(.//Fields/Field/DataField)[4]', 'nvarchar(4000)'))) ,'>', '>') ,'<', '<') AS Fields4 ,REPLACE(REPLACE(LTRIM((R.RptNode.value('(.//Fields/Field/DataField)[5]', 'nvarchar(4000)'))) ,'>', '>') ,'<', '<') AS Fields5 ,REPLACE(REPLACE(LTRIM((R.RptNode.value('(.//Fields/Field/DataField)[6]', 'nvarchar(4000)'))) ,'>', '>') ,'<', '<') AS Fields6 ,REPLACE(REPLACE(LTRIM((R.RptNode.value('(.//Fields/Field/DataField)[7]', 'nvarchar(4000)'))) ,'>', '>') ,'<', '<') AS Fields7 ,REPLACE(REPLACE(LTRIM((R.RptNode.value('(.//Fields/Field/DataField)[8]', 'nvarchar(4000)'))) ,'>', '>') ,'<', '<') AS Fields8 ,REPLACE(REPLACE(LTRIM((R.RptNode.value('(.//Fields/Field/DataField)[9]', 'nvarchar(4000)'))) ,'>', '>') ,'<', '<') AS Fields9 ,REPLACE(REPLACE(LTRIM((R.RptNode.value('(.//Fields/Field/DataField)[10]', 'nvarchar(4000)'))) ,'>', '>') ,'<', '<') AS Fields10 ,REPLACE(REPLACE(LTRIM((R.RptNode.value('(.//Fields/Field/DataField)[11]', 'nvarchar(4000)'))) ,'>', '>') ,'<', '<') AS Fields11 ,REPLACE(REPLACE(LTRIM((R.RptNode.value('(.//Fields/Field/DataField)[12]', 'nvarchar(4000)'))) ,'>', '>') ,'<', '<') AS Fields12 ,REPLACE(REPLACE(LTRIM((R.RptNode.value('(.//Fields/Field/DataField)[13]', 'nvarchar(4000)'))) ,'>', '>') ,'<', '<') AS Fields13 ,REPLACE(REPLACE(LTRIM((R.RptNode.value('(.//Fields/Field/DataField)[14]', 'nvarchar(4000)'))) ,'>', '>') ,'<', '<') AS Fields14 ,REPLACE(REPLACE(LTRIM((R.RptNode.value('(.//Fields/Field/DataField)[15]', 'nvarchar(4000)'))) ,'>', '>') ,'<', '<') AS Fields15 ,REPLACE(REPLACE(LTRIM((R.RptNode.value('(.//Fields/Field/DataField)[16]', 'nvarchar(4000)'))) ,'>', '>') ,'<', '<') AS Fields16 ,REPLACE(REPLACE(LTRIM((R.RptNode.value('(.//Fields/Field/DataField)[17]', 'nvarchar(4000)'))) ,'>', '>') ,'<', '<') AS Fields17 ,REPLACE(REPLACE(LTRIM((R.RptNode.value('(.//Fields/Field/DataField)[18]', 'nvarchar(4000)'))) ,'>', '>') ,'<', '<') AS Fields18 ,REPLACE(REPLACE(LTRIM((R.RptNode.value('(.//Fields/Field/DataField)[19]', 'nvarchar(4000)'))) ,'>', '>') ,'<', '<') AS Fields19 ,REPLACE(REPLACE(LTRIM((R.RptNode.value('(.//Fields/Field/DataField)[20]', 'nvarchar(4000)'))) ,'>', '>') ,'<', '<') AS Fields20 ,REPLACE(REPLACE(LTRIM((R.RptNode.value('(.//Fields/Field/DataField)[21]', 'nvarchar(4000)'))) ,'>', '>') ,'<', '<') AS Fields21 ,REPLACE(REPLACE(LTRIM((R.RptNode.value('(.//Fields/Field/DataField)[22]', 'nvarchar(4000)'))) ,'>', '>') ,'<', '<') AS Fields22 ,REPLACE(REPLACE(LTRIM((R.RptNode.value('(.//Fields/Field/DataField)[23]', 'nvarchar(4000)'))) ,'>', '>') ,'<', '<') AS Fields23 ,REPLACE(REPLACE(LTRIM((R.RptNode.value('(.//Fields/Field/DataField)[24]', 'nvarchar(4000)'))) ,'>', '>') ,'<', '<') AS Fields24 ,REPLACE(REPLACE(LTRIM((R.RptNode.value('(.//Fields/Field/DataField)[25]', 'nvarchar(4000)'))) ,'>', '>') ,'<', '<') AS Fields25 ,REPLACE(REPLACE(LTRIM((R.RptNode.value('(.//Fields/Field/DataField)[26]', 'nvarchar(4000)'))) ,'>', '>') ,'<', '<') AS Fields26 ,REPLACE(REPLACE(LTRIM((R.RptNode.value('(.//Fields/Field/DataField)[27]', 'nvarchar(4000)'))) ,'>', '>') ,'<', '<') AS Fields27 ,REPLACE(REPLACE(LTRIM((R.RptNode.value('(.//Fields/Field/DataField)[28]', 'nvarchar(4000)'))) ,'>', '>') ,'<', '<') AS Fields28 ,REPLACE(REPLACE(LTRIM((R.RptNode.value('(.//Fields/Field/DataField)[29]', 'nvarchar(4000)'))) ,'>', '>') ,'<', '<') AS Fields29 ,REPLACE(REPLACE(LTRIM((R.RptNode.value('(.//Fields/Field/DataField)[30]', 'nvarchar(4000)'))) ,'>', '>') ,'<', '<') AS Fields30 ,REPLACE(REPLACE(LTRIM((R.RptNode.value('(.//Fields/Field/DataField)[31]', 'nvarchar(4000)'))) ,'>', '>') ,'<', '<') AS Fields31 FROM (SELECT RPT.Path AS ReportPath ,RPT.name AS ReportName ,CONVERT(xml, CONVERT(varbinary(max), RPT.content)) AS contentXML FROM [ReportServer].dbo.[Catalog] AS RPT INNER JOIN [ReportServer].dbo.ExecutionLogStorage Storage ON RPT.ItemID = Storage.ReportID WHERE RPT.Type = 2 ) AS RPT cross APPLY RPT.contentXML.nodes('/Report/DataSets/DataSet') AS R(RptNode) cross APPLY RPT.contentXML.nodes('/Report/DataSources/DataSource') AS Y(RptNode) ) SELECT DEF.ReportPath ,contentXML ,Def.Reportname ,DEF.DataSourceName ,DEF.DataSetName ,DEF.Fields1 ,DEF.Fields2 ,DEF.Fields3 ,DEF.Fields4 ,DEF.Fields5 ,DEF.Fields6 ,DEF.Fields7 ,DEF.Fields8 ,DEF.Fields9 ,DEF.Fields10 ,DEF.Fields11 ,DEF.Fields12 ,DEF.Fields13 ,DEF.Fields14 ,DEF.Fields15 ,DEF.Fields16 ,DEF.Fields17 ,DEF.Fields18 ,DEF.Fields19 ,DEF.Fields20 ,DEF.Fields21 ,DEF.Fields22 ,DEF.Fields23 ,DEF.Fields24 ,DEF.Fields25 ,DEF.Fields26 ,DEF.Fields27 ,DEF.Fields28 ,DEF.Fields29 ,DEF.Fields30 ,DEF.Fields31 into #rawdata1 FROM DEF go select ReportName, DataSourceName, DatasetName,Fields1 into [ServerStatistics].dbo.ReportFieldsWith3MonthHistory from #rawdata1 union all select ReportName, DataSourceName, DatasetName,Fields2 from #rawdata1 union all select ReportName, DataSourceName, DatasetName,Fields3 from #rawdata1 union all select ReportName, DataSourceName, DatasetName,Fields4 from #rawdata1 union all select ReportName, DataSourceName, DatasetName,Fields5 from #rawdata1 union all select ReportName, DataSourceName, DatasetName,Fields6 from #rawdata1 union all select ReportName, DataSourceName, DatasetName,Fields7 from #rawdata1 union all select ReportName, DataSourceName, DatasetName,Fields8 from #rawdata1 union all select ReportName, DataSourceName, DatasetName,Fields9 from #rawdata1 union all select ReportName, DataSourceName, DatasetName,Fields10 from #rawdata1 union all select ReportName, DataSourceName, DatasetName,Fields11 from #rawdata1 union all select ReportName, DataSourceName, DatasetName,Fields12 from #rawdata1 union all select ReportName, DataSourceName, DatasetName,Fields13 from #rawdata1 union all select ReportName, DataSourceName, DatasetName,Fields14 from #rawdata1 union all select ReportName, DataSourceName, DatasetName,Fields15 from #rawdata1 union all select ReportName, DataSourceName, DatasetName,Fields16 from #rawdata1 union all select ReportName, DataSourceName, DatasetName,Fields17 from #rawdata1 union all select ReportName, DataSourceName, DatasetName,Fields18 from #rawdata1 union all select ReportName, DataSourceName, DatasetName,Fields19 from #rawdata1 union all select ReportName, DataSourceName, DatasetName,Fields20 from #rawdata1 union all select ReportName, DataSourceName, DatasetName,Fields21 from #rawdata1 union all select ReportName, DataSourceName, DatasetName,Fields22 from #rawdata1 union all select ReportName, DataSourceName, DatasetName,Fields23 from #rawdata1 union all select ReportName, DataSourceName, DatasetName,Fields24 from #rawdata1 union all select ReportName, DataSourceName, DatasetName,Fields25 from #rawdata1 union all select ReportName, DataSourceName, DatasetName,Fields26 from #rawdata1 union all select ReportName, DataSourceName, DatasetName,Fields27 from #rawdata1 union all select ReportName, DataSourceName, DatasetName,Fields28 from #rawdata1 union all select ReportName, DataSourceName, DatasetName,Fields29 from #rawdata1 union all select ReportName, DataSourceName, DatasetName,Fields30 from #rawdata1 union all select ReportName, DataSourceName, DatasetName,Fields31 from #rawdata1 delete from [ServerStatistics].dbo.ReportFieldsWith3MonthHistory where Fields1 is null |
Steve has presented papers at 8 PASS Summits and one at PASS Europe 2009 and 2010. He has recently presented a Master Data Services presentation at the PASS Amsterdam Rally.
Steve has presented 5 papers at the Information Builders' Summits. He is a PASS regional mentor.
View all posts by Steve Simon
- Reporting in SQL Server – Using calculated Expressions within reports - December 19, 2016
- How to use Expressions within SQL Server Reporting Services to create efficient reports - December 9, 2016
- How to use SQL Server Data Quality Services to ensure the correct aggregation of data - November 9, 2016